WIF Slide Below $3.582 Sparks Fears Of Further Losses
WIF latest dip below the crucial $3.582 support has triggered concerns across the market, as bearish sentiment appears to be gathering strength. Its break below this key level could pave the way for even greater losses, leaving traders to question whether the bulls can stage a comeback or if further declines are inevitable. As downside risks grow, this analysis aims to examine WIF’s recent drop below the critical $3.582 support level and explore the potential implications of this bearish shift for future price movement. By assessing current market sentiment, key technical indicators, and possible support zones, we seek to determine whether WIF is positioned for more losses or if a reversal may be on the horizon. Examining WIF’s Drop Below The Critical $3.582 Support Level On the 4-hour chart, WIF has recently broken below the $3.582 level, triggering bearish momentum as the price moves toward the $2.896 support range and the 100-day Simple Moving Average (SMA). As the bearish trend develops, the market is closely watching for any signs of stabilization or a deeper slide toward key support zones. The 4-hour Relative Strength Index (RSI) has dropped from the overbought zone to 53%, signaling a reduction in upward momentum. This move toward neutral territory suggests that buying pressure may be waning, and market participants will be looking for indications of continued decline or a potential shift in momentum. Related Reading: Dogwifhat (WIF) Price Set To Skyrocket 2,500%, Predicts Renowned Economist On the daily chart, WIF is showing strong negative strength, highlighted by a bearish candlestick pattern that has pushed the price below the critical $3.582 support. This pattern indicates that sellers are firmly in control of the market, relentlessly driving the price lower, prompting a strong likelihood of further drops in the near term. An analysis of the 1-day RSI suggests WIF may face extended losses as it has dropped from a high of 80% to 64%, indicating a reduction in buying pressure. Typically, this decline points to a possible weakness of bullish momentum, with more downward pressure likely if the RSI continues to wane. Potential Support Zones To Watch If WIF Continues To Drop If WIF continues to drop, key support zones to watch out for include the $2.896 level, which has previously acted as a critical point for price stabilization. Below this, the next support level to monitor is positioned around $2.257, where WIF may find additional buying interest. A break below these levels could open the door to further declines toward other psychological support zones. Related Reading: Strong Buy Signal For DogWifHat (WIF) – Key Indicator Hints At Rally To $4 Conversely, if WIF breaks below the $2.896 support level, it could signal the start of a bullish comeback, potentially pushing the price back above the $3.582 level and toward higher resistance points. Featured image from YouTube, chart from Tradingview.com

WIF latest dip below the crucial $3.582 support has triggered concerns across the market, as bearish sentiment appears to be gathering strength. Its break below this key level could pave the way for even greater losses, leaving traders to question whether the bulls can stage a comeback or if further declines are inevitable.
As downside risks grow, this analysis aims to examine WIF’s recent drop below the critical $3.582 support level and explore the potential implications of this bearish shift for future price movement. By assessing current market sentiment, key technical indicators, and possible support zones, we seek to determine whether WIF is positioned for more losses or if a reversal may be on the horizon.
Examining WIF’s Drop Below The Critical $3.582 Support Level
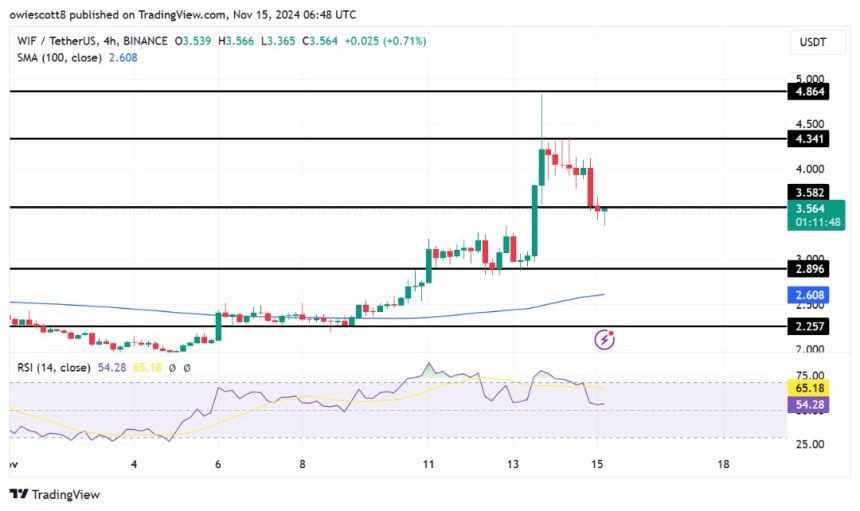
On the 4-hour chart, WIF has recently broken below the $3.582 level, triggering bearish momentum as the price moves toward the $2.896 support range and the 100-day Simple Moving Average (SMA). As the bearish trend develops, the market is closely watching for any signs of stabilization or a deeper slide toward key support zones.

The 4-hour Relative Strength Index (RSI) has dropped from the overbought zone to 53%, signaling a reduction in upward momentum. This move toward neutral territory suggests that buying pressure may be waning, and market participants will be looking for indications of continued decline or a potential shift in momentum.
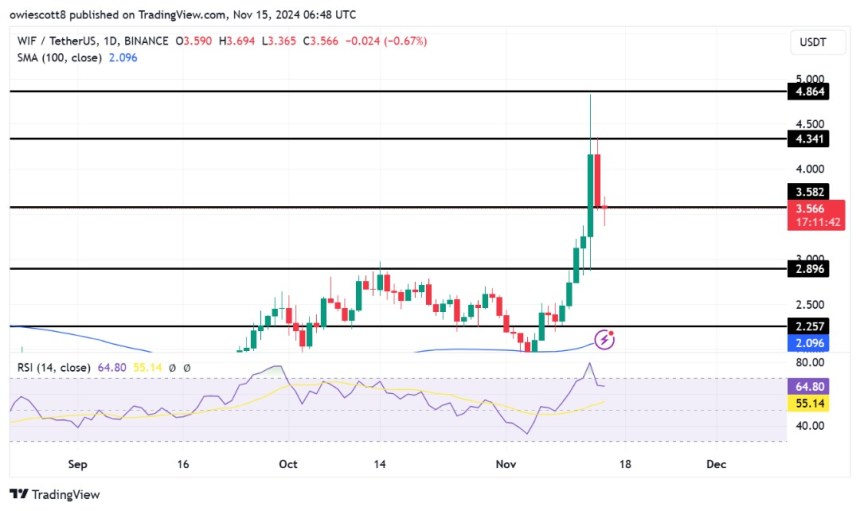
On the daily chart, WIF is showing strong negative strength, highlighted by a bearish candlestick pattern that has pushed the price below the critical $3.582 support. This pattern indicates that sellers are firmly in control of the market, relentlessly driving the price lower, prompting a strong likelihood of further drops in the near term.

An analysis of the 1-day RSI suggests WIF may face extended losses as it has dropped from a high of 80% to 64%, indicating a reduction in buying pressure. Typically, this decline points to a possible weakness of bullish momentum, with more downward pressure likely if the RSI continues to wane.
Potential Support Zones To Watch If WIF Continues To Drop
If WIF continues to drop, key support zones to watch out for include the $2.896 level, which has previously acted as a critical point for price stabilization. Below this, the next support level to monitor is positioned around $2.257, where WIF may find additional buying interest. A break below these levels could open the door to further declines toward other psychological support zones.
Conversely, if WIF breaks below the $2.896 support level, it could signal the start of a bullish comeback, potentially pushing the price back above the $3.582 level and toward higher resistance points.
What's Your Reaction?


