Tron (TRX) Sharpe Ratio Shoots High-Risk Signal, Price Crash Incoming?
Data shows the Tron Sharpe Ratio has observed a rapid increase into a territory that has proven to be bearish for TRX’s value in the past. Sharpe Ratio Could Imply Tron Is Overheated Now As explained by an analyst in a CryptoQuant Quicktake post, the 180-day of the Tron Sharpe Ratio is now flashing a […]

Data shows the Tron Sharpe Ratio has observed a rapid increase into a territory that has proven to be bearish for TRX’s value in the past.
Sharpe Ratio Could Imply Tron Is Overheated Now
As explained by an analyst in a CryptoQuant Quicktake post, the 180-day of the Tron Sharpe Ratio is now flashing a red alert. The “Sharpe Ratio” here refers to an indicator that compares the returns of a given asset with its risk.
Its value is calculated as the difference between the asset’s expected return and the risk-free rate of return, divided by the volatility. This metric tells us whether the returns of the commodity are worth the risk involved with it.
Below is the chart shared by the quant that shows the trend in the 180-day version of the Sharpe Ratio for Tron over the last few years:

As the above graph shows, the 180-day Tron Sharpe Ratio has recently observed some rapid growth and reached what has historically been the ‘red’ zone.
In the chart, the quant has highlighted the instances of the metric breaching into this region during the last few years. TRX appears to have generally hit some top whenever the indicator’s value has risen this high.
Tron is now inside this same high-risk zone once again, but it’s possible that the coin may not immediately hit a top, as the indicator is still at a lower level than during some of the tops. The analyst cautions, however, saying:
While TRX may continue its upward trend in the short term, holding positions in a high-risk zone like this can be detrimental. The potential for gains becomes limited compared to the increased likelihood of a sharp pullback, making this an unfavorable situation for long-term strategies.
It remains to be seen how the cryptocurrency price will develop from here on out, considering the trend that has emerged in its 180-day Sharpe Ratio.
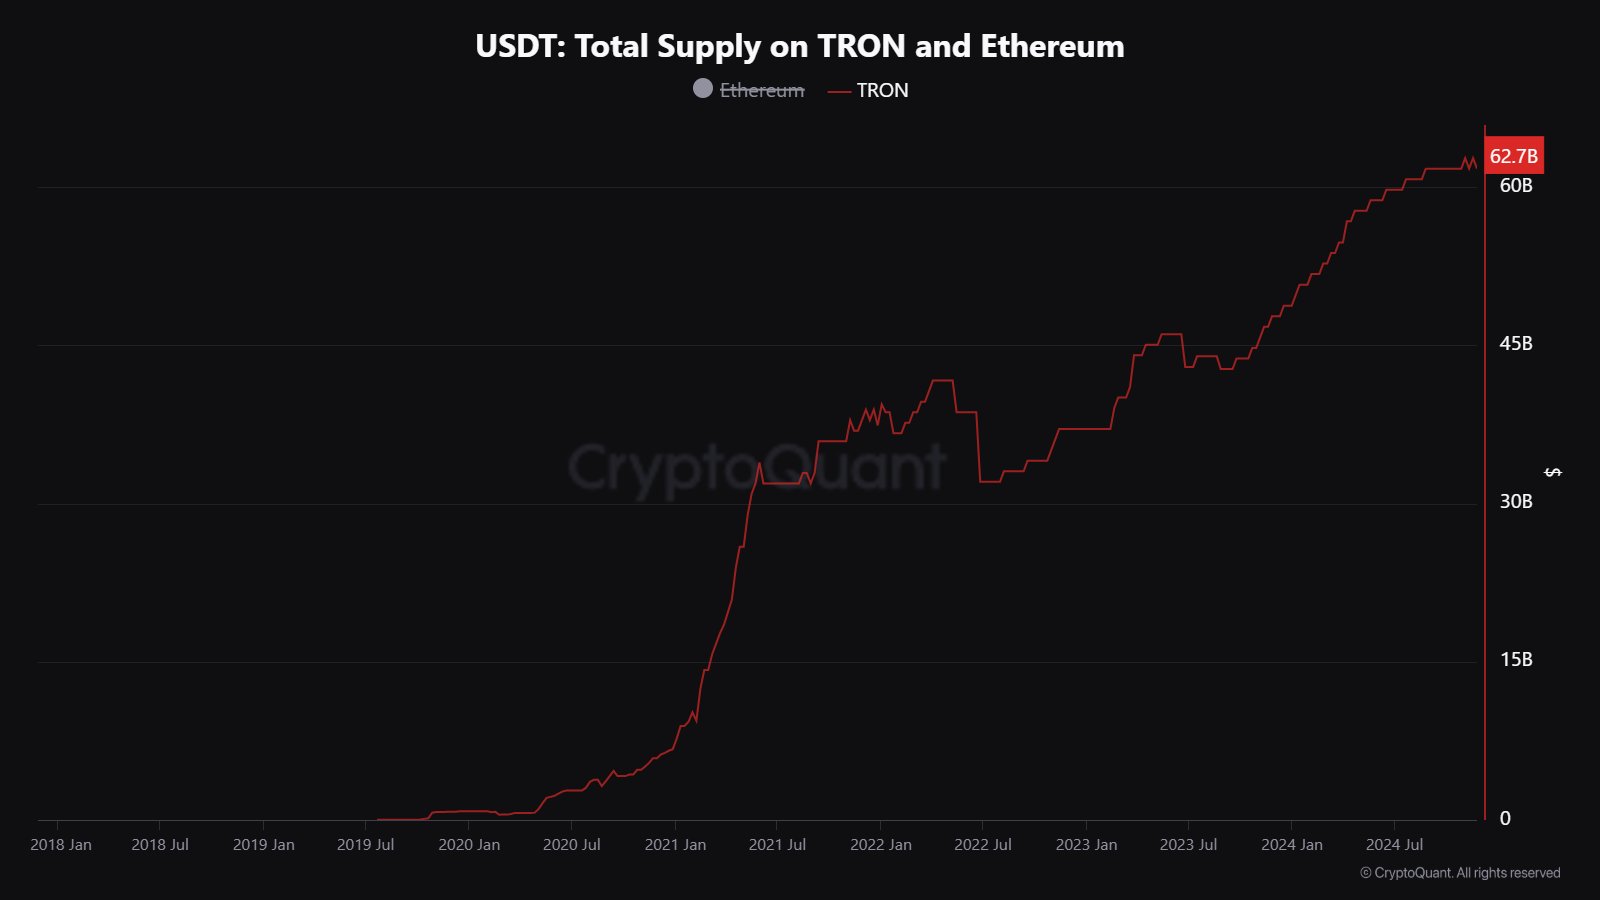
In some other news, the supply of Tether’s stablecoin, USDT, has recently witnessed considerable Tron network growth, as CryptoQuant community analyst Maartunn pointed out in an X post.

The USDT supply on Tron has gone from $47.75 billion to $65.7 billion over the past year, representing an increase of more than 37%. This rise naturally shows how interest in using the stablecoin has increased on the network.
TRX Price
Tron broke through the $22 level a few days ago, but it appears the asset has since witnessed a cooldown in bullish momentum, as its price is now floating around $20.
What's Your Reaction?


