The Top React Spreadsheet Tools
Explore the top React spreadsheets and their notable features for your applications in this review of leading options.

If you’re a front-end developer, React is a popular JavaScript framework you can use to create the UI for your web applications. This makes sense, as React can handle the complex and innovative needs of applications' user interfaces.
\ Spreadsheets are a common requirement for projects built in React and for any business that needs to collect and make sense of data very quickly. The users of the spreadsheets in those apps expect to see a specific kind of user interface when working with spreadsheets, namely that of Microsoft Excel.
\ To integrate advanced Excel-like capabilities in React applications, developers have their choice of several spreadsheet solutions. However, not all solutions are the same. When the goals are to create a high-quality product that addresses the needs of your end users and to reduce development time, it’s important to choose the best React spreadsheet component.
Why Would Someone Need a Spreadsheet Component?
A spreadsheet component is a must-have for many organizations. Spreadsheets are familiar, efficient components for collecting, organizing, and analyzing data. The way in which a spreadsheet is structured facilitates easy data visualization. They also enable calculation and data manipulation with formulas and functions.
\ These features, which are now so essential to decision-making for organization leaders, have nearly unlimited use cases for the React web applications that have become an inherent part of modern business operations. This may look different for each industry. For example, marketers may need to keep track of multiple KPIs to determine the success of a marketing campaign. In the finance industry, end users rely on Excel spreadsheets and models in every aspect of their business, specifically for modeling, budgeting, reporting, and much more.
\ While Excel may be the go-to spreadsheet software, it is not exactly an ideal solution when your web application requires spreadsheet capability. Using Excel in web applications could expose both your company and its web application end users to privacy and security risks.
\ The better, safer option is a secure and feature-filled React spreadsheet component that allows developers to create a spreadsheet that aligns directly with their web application’s purpose.
\ In this post, we’ll examine some of the top React spreadsheet components so you can better decide which one is best for your projects' needs.
SpreadJS by MESCIUS
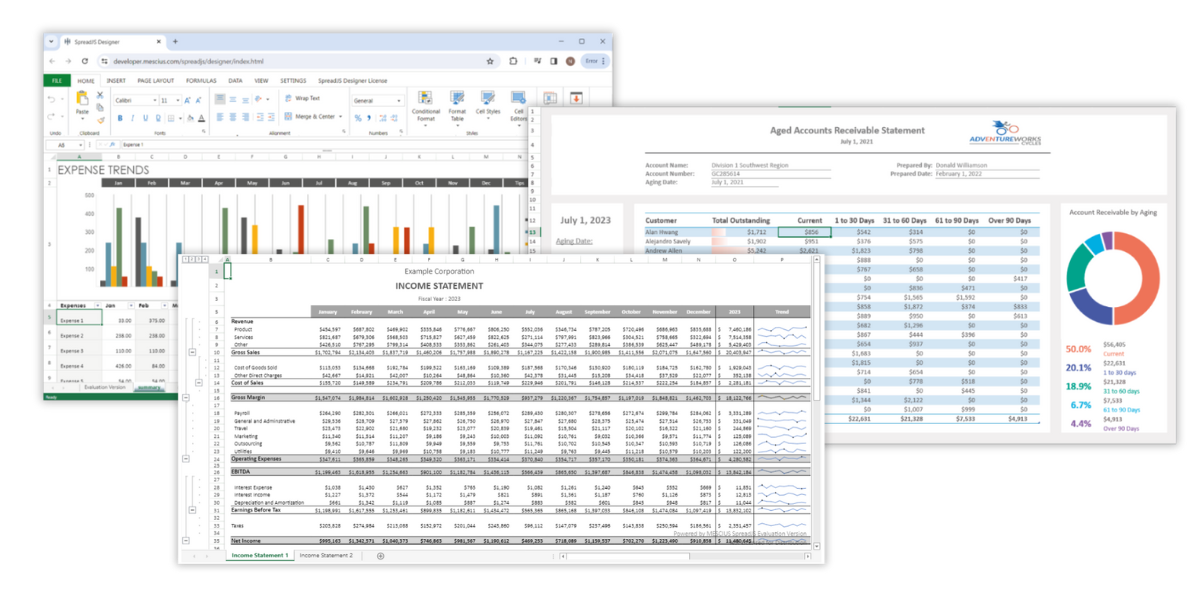
SpreadJS is MESCIUS’ JavaScript spreadsheet component that provides the ultimate Excel-like user experience. When you use SpreadJS for your JavaScript applications, you are using a secure solution that eliminates risk while maintaining functionality and ease of use.
\ SpreadJS was developed to execute spreadsheet actions seamlessly. You can import from and export to Excel files quickly and easily. There is a complete function library that includes statistical and dynamic functions, dynamic arrays, and custom user-defined functions that your end users can leverage to analyze spreadsheet data. The function support includes data validation and conditional formatting. Data visualization makes complex data analysis simple with a variety of customizable tables and charts offered.
Notable Features
SpreadJS, which also supports Angular, Vue, and Typescript, is a React spreadsheet component that focuses on advanced features and ease of use. It helps simplify the spreadsheet construction process with optional add-ons like the customizable Designer Ribbon Component, featuring a ribbon bar, formula bar, status bar, side panels, and context menus. There is also the code-free SpreadJS Designer app that can help the developer streamline spreadsheet creation and editing with its WYSIWYG interface.
\ SpreadJS begins the Excel-like user experience by providing a very familiar UI that includes row and column headers, context menus, worksheets, workbooks, and more. There is full support for importing and exporting Excel, CSV, JSON, and SJS files. End-users can also export to PDF and print.
\ End users can leverage an ultra-powerful calculation engine that provides more than 500 functions. The functions include dynamic arrays as well as financial and statistical functions. You can also create your own custom functions.
\ The spreadsheets are equipped with advanced functionalities such as merges, comments, and cell and conditional formatting. The solution is optimized for fast performance, so your end users won’t experience any lag, achieving results in a minuscule amount of time when conducting operations like sorting data, populating cells, or conducting complex formula calculations on millions of cells.
\ With more than 11 chart groups, the end user benefits from a wide range of charts for data visualization, including sparklines. You can enrich the spreadsheet even more with powerful optional add-ons like Designer Ribbon, PivotTable, Gantt Sheet, and ReportSheet.
\ SpreadJS provides the tools to generate the simplest spreadsheet for basic data entry to the most complex spreadsheets requiring intricate, complex calculations and data visualizations, depending on your web applications' needs.
Handsontable
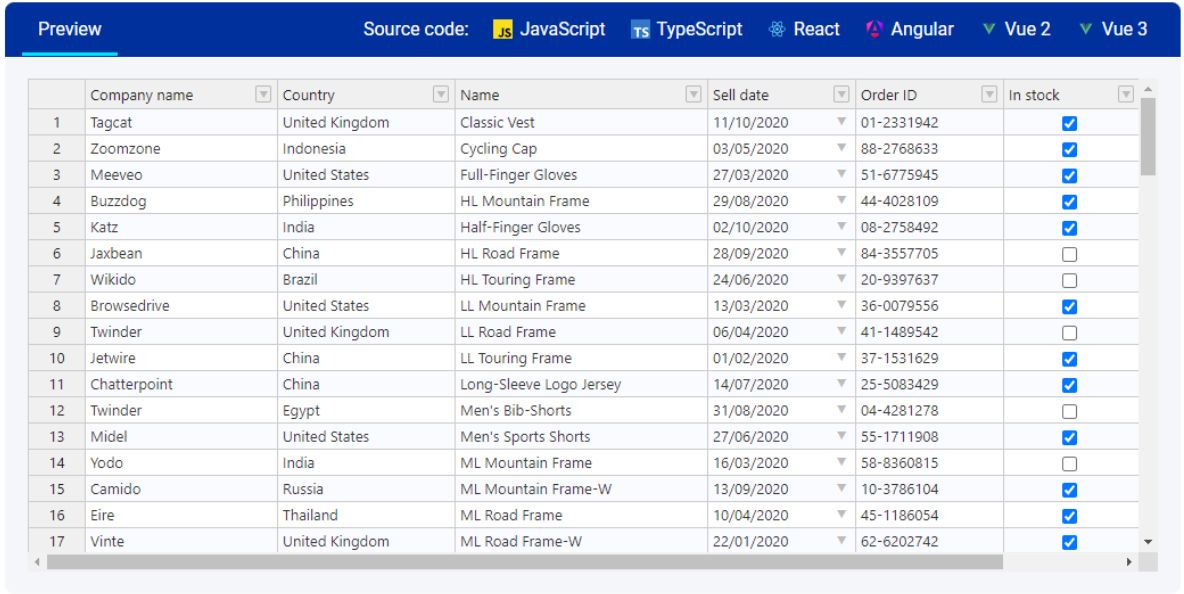
Handsontable is a minimalistic data grid component that couples its features with a spreadsheet UI. The result is a lightweight spreadsheet option for web projects. Its library can be used with other JavaScript frameworks, including Angular, Vue, and JavaScript.
\ Users are not required to learn a brand-new way of navigating a spreadsheet because Handsontable features the usual spreadsheet layout with easy-to-locate headers for columns and rows. There is an icon pack with which you can create and customize toolbars, menu bars, and context menus. The context menu provides quick access to commands for adding or deleting rows or columns and other contextual actions. Export a grid’s raw data to CSV format as a downloadable file, blog, or string.
\ There are not as many features as you would find on other, more well-rounded spreadsheets, but it includes the basic functionalities to make an effective spreadsheet for your application. You can incorporate elements such as cell merging, conditional formatting, text alignment, comments, formatting cells, disabling cells, column and row freezing, events, and hooks.
\ The HyperFormula calculation engine has a library of 386 functions for calculations. Integrating data visualization capabilities may be a little more cumbersome than other spreadsheet solutions, as Handsontable does not support charts. However, Handsontable can be an easy-to-use solution if you need a basic spreadsheet to quickly enter and adjust data and other operations or if you have the resources and time to code or create the plug-ins you require.
Syncfusion-React Spreadsheet
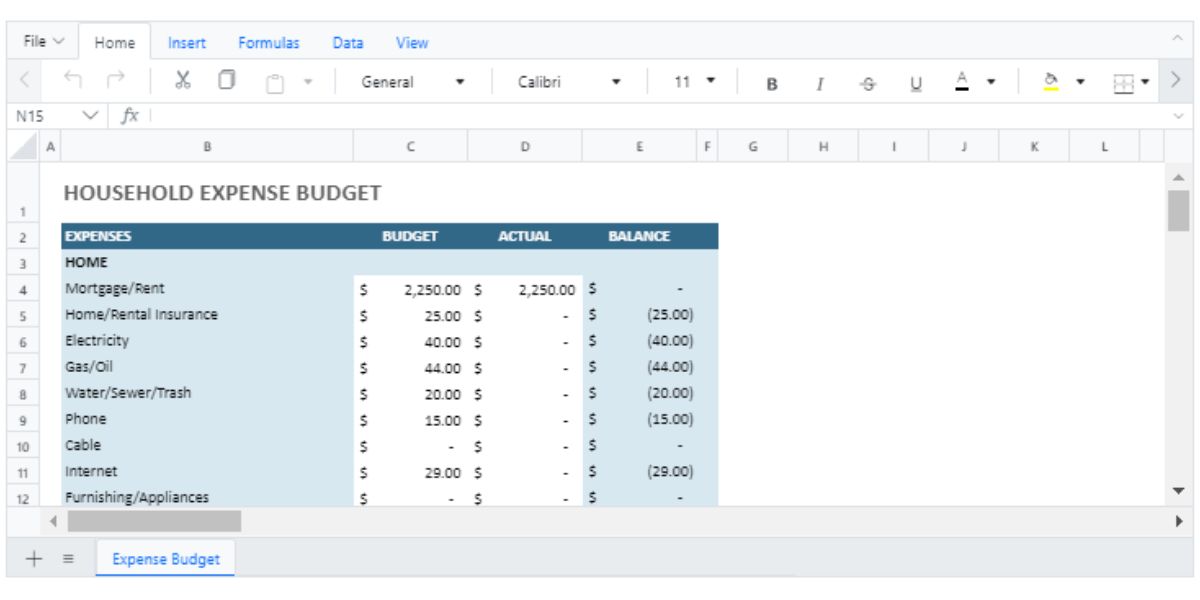
Syncfusion’s React spreadsheet component offers several features and functionalities. The React spreadsheet component also works with Angular, JavaScript, Vue, ASP.NET Core, and ASP.NET MVC frameworks and facilitates working on the go with its adaptive layout, which makes it usable on screens of any size. Its layout is similar to that of Excel.
\ There is support for Excel, CSV, and PDF files, as well as printing. Cells and numbers formatting, conditional formatting, data binding with local and remote sources, and adding and customizing images are just a few of the elements that can be used. The built-in calculation engine provides a wide range of formula calculations.
\ For data visualization, a chart feature is available that includes six types of charts. You can expand the chart selection with plug-ins for Gantt charts, sparklines, and more. There are also other types of add-ons, like PivotTable and a Ribbon component, that you can use to help create your desired spreadsheet.
\ The main features of Syncfusion’s React spreadsheet component seem to be the quantity and range of features it provides.
Jspreadsheet
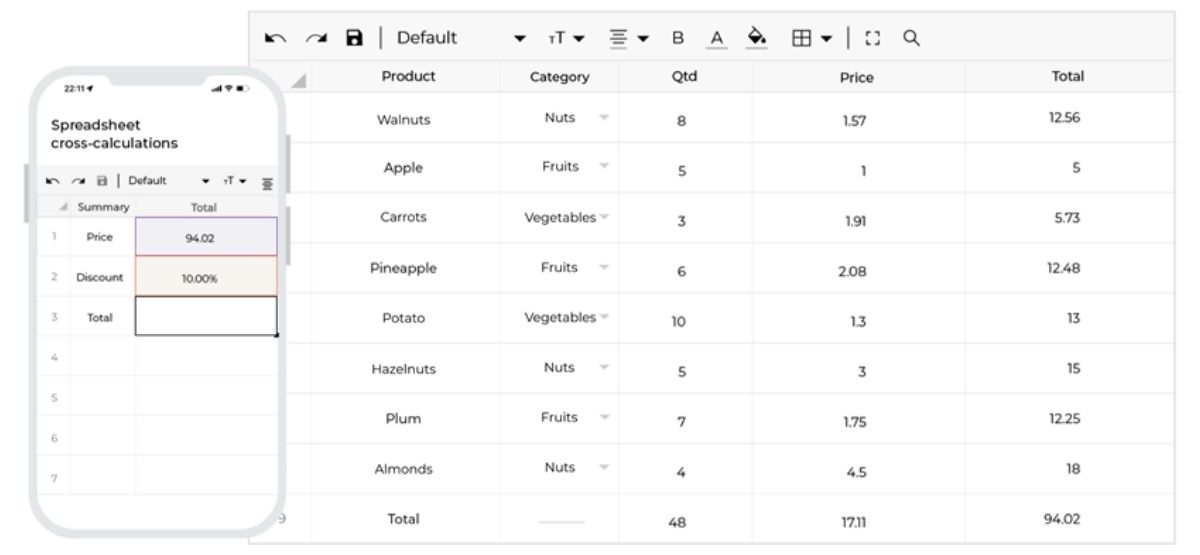
Jspreadsheet’s JavaScript data grid with spreadsheet control features that support not only React but also multiple other frameworks, including Angular, Vue, and JavaScript. Integration capability is also available for ChartJS, Salesforce, and ChatGPT.
\ It is worth noting that many of the features that are typically built-in and that make spreadsheets richer require plug-ins to use Jspreadsheet. For example, different extensions are needed to import and export XLSX, to export to HTML and PDF, to import CSV, for integration with Google Sheets, and for printing capabilities.
\ There are extensions for using the calculation engine to access its more than 400 functions and to use charts. You’ll also have to plug in extensions for data validations, use a more advanced commenting feature, and search and replace data.
\ You can also expand the functionality of the component by integrating third-party JavaScript plugins to further customize your spreadsheet’s user interface. Just keep in mind the impact this may have on development time.
\ With that in mind, Jspreadsheet can be a useful spreadsheet component. The worksheet layout includes the customary rows and columns, as well as headers and footers. The context menu is also a notable feature of the UI, as are the clipboard and keyboard shortcuts you can customize.
Infragistics-IgrSpreadsheet
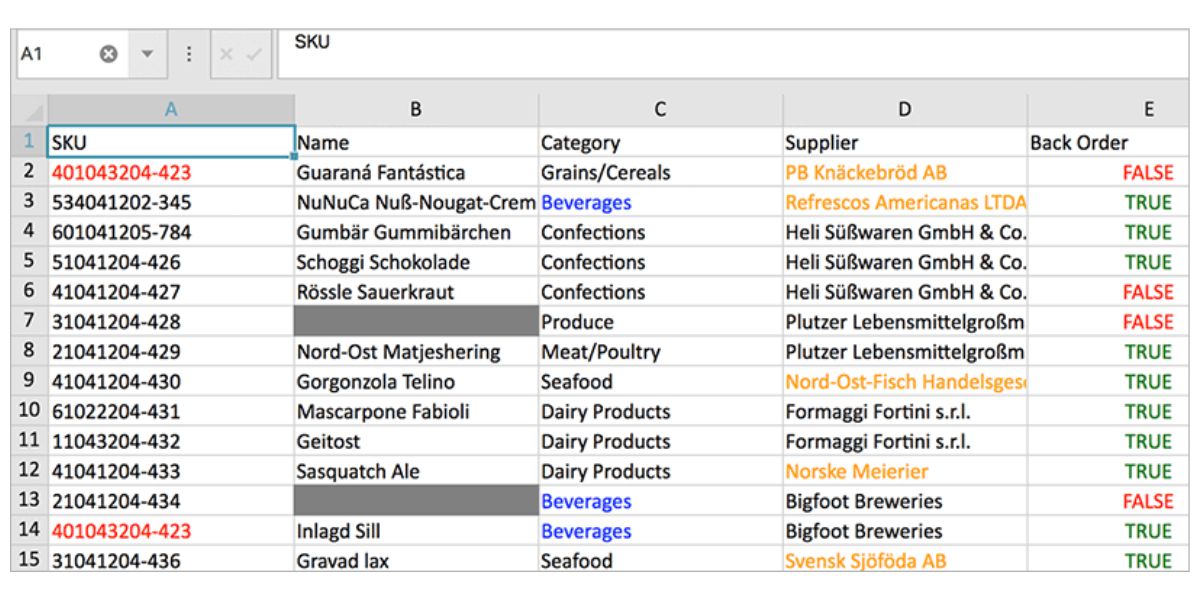
Infragistic’s familiar interface lets end users begin working with spreadsheets immediately without needing to learn an unfamiliar layout. They will have no difficulty navigating the various elements, such as cells and worksheets, even with the completed keyboard navigation feature the component provides. There is support for CSV files, all Excel file versions, and printing.
\ You can add familiar operations to spreadsheets made with IgrSpreadsheet, including conditional formatting, data validation, cell formatting, filtering, sorting, hyperlinks, and more. Additional configuration options include adjusting header and gridline visibility, zoom level, and worksheet protection.
\ With the spreadsheet chart adapter, end users can visualize data in more than 35 chart types and sparklines. This includes variations of line and column charts, among others, that users can interact with. End users can also import and export charts to and from the spreadsheet and Excel. For formulas, there is a built-in calculation engine with more than 300 formulas.
\ IgrSpreadsheet, which also supports Angular and Blazor, is a good React spreadsheet option but doesn’t offer the extra add-ons that can extend the spreadsheet’s functionality beyond standard capabilities.
Telerik-KendoReact Spreadsheet
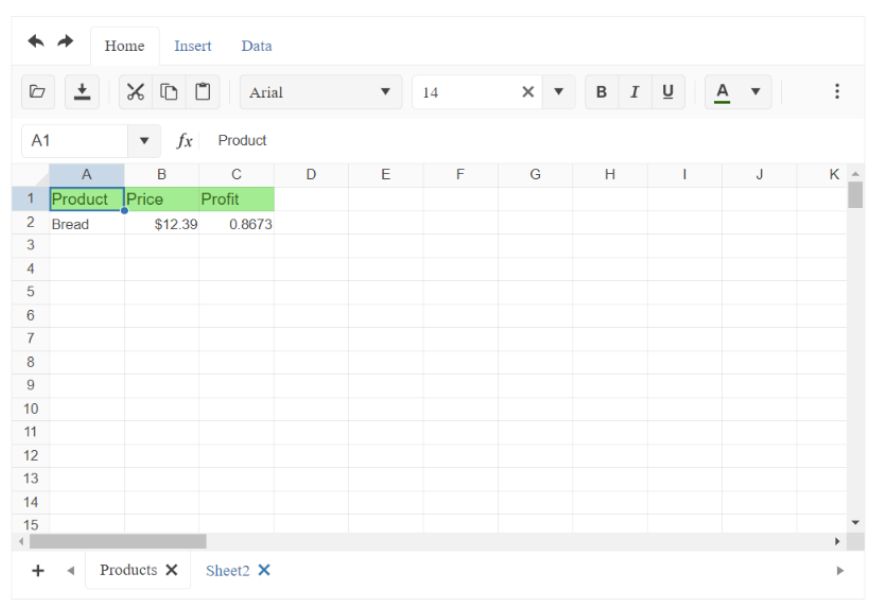
The KendoReact Spreadsheet is relatively easy to use and provides a lot of flexibility. In addition to importing and exporting XLSX files directly, it lets you work with data in a native JSON format. There is also support for exporting to PDF format and printing.
\ The toolbar can be configured to display both built-in and custom tools. You can also create custom JavaScript functions inside formulas to address specific needs. Additional built-in features include error-handling support, cell locks, events management, and keyboard navigation. At just over 250 built-in formulas and functions, the KendoReact spreadsheet may not feature as much calculation power as other options, but it does make sure to provide support for arrays.
\ For a more robust spreadsheet with advanced functionality, you will need to add on other KendoReact components to leverage features like charts (including sparklines and series-type charts) as well as Gantt sheets and PivotGrids.
Conclusion
Many of the features and capabilities of the various spreadsheet components are very similar. They all have an Excel-like user interface, although to varying degrees. They also all provide some degree of formula calculation capability and support for Excel files.
\ However, SpreadJS stands apart from the others because it truly provides a complete Excel-like experience for the end user. The library offers easy-to-use components that developers can employ to make rich, impactful spreadsheets specifically customized for their target web application.
\ At the front end, no guesswork will be involved when navigating a spreadsheet. A powerful calculation engine with an extensive selection of functions and customization capability ensures your end users have what they require to work with the spreadsheet data as necessary. You can apply custom cell types and use data validation rules to control spreadsheet input and reduce errors.
\ Data visualization elements, like enhanced charts and sparklines, are available so end users can gain better insights from the spreadsheet data. There is also customizable formula dependency tracing for regulatory compliance and auditing.
\ With MESCIUS’ SpreadJS, you can deliver Excel spreadsheet capability to your web projects in addition to a superior user experience.
\
What's Your Reaction?


