


Solana’s POPCAT Hits Key $1 Mark Amid 360% Surge: Correction Risks Loom
Solana-based memecoin POPCAT has seen significant interest from mainstream traders, achieving a remarkable 117% growth in the past two weeks and a 360% increase in the last 30 days. POPCAT’s social dominance and trading volume have surged, with historical patterns indicating a likely correction due to the asset becoming overbought. Solana-based memecoin POPCAT has garnered [...]

- Solana-based memecoin POPCAT has seen significant interest from mainstream traders, achieving a remarkable 117% growth in the past two weeks and a 360% increase in the last 30 days.
- POPCAT’s social dominance and trading volume have surged, with historical patterns indicating a likely correction due to the asset becoming overbought.
Solana-based memecoin POPCAT has garnered strong interest recently from some of the mainstream traders as the altcoin has registered a staggering 117% growth in the past two weeks. Market intelligence platform Santiment has also posted about Solana memecoin POPCAT’s growth in its recent analysis. The update emphasized that the POPCAT price has more than doubled since July 11.
POPCAT traded at $0.3519 earlier this month but surged past the $1 threshold over the weekend. From last month’s low of $0.2173, the Solana meme coin has advanced by 360% in just 30 days.
However, the intelligence platform observed that sudden spikes in interest and value often precede corrections. This historical pattern suggests that while the current surge attracts traders, better entry points may emerge after a correction.
POPCAT has drawn attention from mainstream traders after the Solana-based asset has surged +117% since July 11th. Historically, this level of sudden interest as a result of a price surge has a high chance of leading to a correction, where better entry points are likely. pic.twitter.com/Skpkn8Utu6
— Santiment (@santimentfeed) July 21, 2024
Surge In POPCAT Social Value and Market Dominance
POPCAT’s social dominance chart reveals a sharp increase, indicating heightened discussions and focus among traders. This surge in social interest often correlates with FOMO, driving more traders to buy in anticipation of further price increases.
Santiment emphasized that historically, spikes in social dominance typically lead to corrections as the asset becomes overbought.
Notably, POPCAT’s trading volume has seen significant spikes in late February, mid-April, and early July 2024. These periods of high trading activity align with major price movements, such as the recent surge in early July.
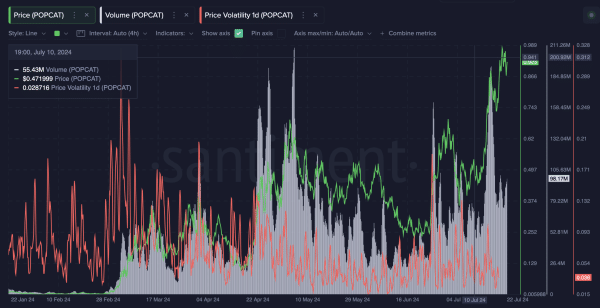
The correlation between volume spikes and price increases suggests strong buying interest driving the current market trend. However, increased volume often precedes higher volatility, indicating the potential for a bearish phase.
POPCAT Technical chart
Analyzing POPCAT’s daily chart reveals critical insights into its current market position. The Bollinger Bands indicate high volatility, with the price nearing the upper band, suggesting an overbought condition.
The 20-period SMA acts as mid-line support, and the price is significantly above this level, reflecting strong upward momentum.
The Relative Strength Index (RSI), currently at 66.75, further supports these observations. It indicates strong momentum without being overbought, suggesting that while there is room for further price increases, a correction may still occur.
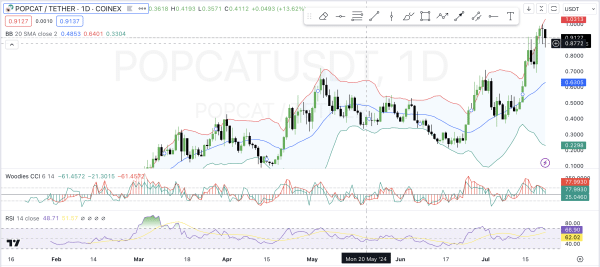
At press time, POPCAT trades 7.16% down in the last 24 hours at $$0.8233.
What's Your Reaction?