Solana Bulls Aim High: $194 Breakout In Sight Amid Market Optimism
Solana is making waves in the market as bullish sentiment propels it toward the crucial $194 resistance level. With positive pressure on its side, SOL is drawing attention from investors eager to see if this push will mark the beginning of a major breakout. A successful breach of $194 could set the stage for a substantial rally, highlighting Solana as a key player in the current market upswing. With SOL edging nearer to the pivotal $194 level, this analysis delves into its breakout potential at this key resistance point, examining the upside movement driving the price upward. By assessing key technical indicators, resistance and support levels, and market sentiment, this piece provides insights into whether SOL bulls can push through and achieve new gains, highlighting the opportunities and risks for investors in this trend. Bullish Momentum Building For Solana On the 4-hour chart, Solana has exhibited strong bullish momentum, with its price pushing decisively above the 100-day Simple Moving Average (SMA) signaling renewed buying interest and a shift in market sentiment as SOL approaches the critical $194 resistance level. Breaking past the 100-day SMA has strengthened the upward case for SOL, suggesting that the asset may have the strength needed to challenge higher price levels. Also, the 4-hour Composite Trend Oscillator for SOL is displaying positive signals, as both the SMA line and the signal line have risen above the zero level and are nearing the overbought zone. Typically, this movement indicates that buying pressure is intensifying, showing that buyers are becoming increasingly dominant in the market. Related Reading: Solana (SOL) Rallies Strongly, Setting Sights on $200 Additionally, the daily chart shows Solana is on a solid upward trajectory, underscored by a strong multiple bullish candlestick that reflects sustained buying pressure. SOL’s position above the 100-day SMA further supports this positive price action, reinforcing the likelihood of continued gains. Trading consistently above this key SMA signals strengthening positive sentiment, as buyers maintain control and push the price toward higher levels, possibly setting the stage for a test of upcoming resistance zones. A closer look at the 1-day composite trend oscillator shows Solana in a bullish phase, with a crossover indicating strong upbeat momentum. As the indicator moves toward the overbought zone, it signals increasing buying strength and market enthusiasm, reflecting a potential for continued gains if optimistic sentiment holds. What A Successful Breakout Could Mean For SOL’s Future If SOL successfully breaks through the $194 resistance level, it could open the door for additional gains, with the next target being its all-time high of $209. A clear breach of this level may trigger a rally that may lead to the formation of new price highs, signaling continued bullish strength. Related Reading: Solana Bulls Push Past $164 Barrier, Momentum Signals More Gains However, if SOL fails to breach $194, there is a risk of a pullback toward lower support levels, such as $164 or $137, where buyers may step in to stabilize the price. Featured image from iStock, chart from Tradingview.com

Solana is making waves in the market as bullish sentiment propels it toward the crucial $194 resistance level. With positive pressure on its side, SOL is drawing attention from investors eager to see if this push will mark the beginning of a major breakout. A successful breach of $194 could set the stage for a substantial rally, highlighting Solana as a key player in the current market upswing.
With SOL edging nearer to the pivotal $194 level, this analysis delves into its breakout potential at this key resistance point, examining the upside movement driving the price upward. By assessing key technical indicators, resistance and support levels, and market sentiment, this piece provides insights into whether SOL bulls can push through and achieve new gains, highlighting the opportunities and risks for investors in this trend.
Bullish Momentum Building For Solana
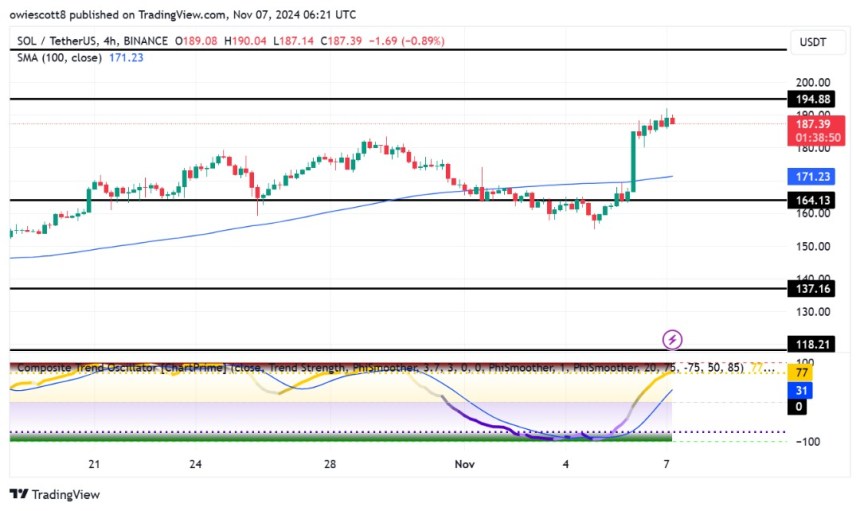
On the 4-hour chart, Solana has exhibited strong bullish momentum, with its price pushing decisively above the 100-day Simple Moving Average (SMA) signaling renewed buying interest and a shift in market sentiment as SOL approaches the critical $194 resistance level. Breaking past the 100-day SMA has strengthened the upward case for SOL, suggesting that the asset may have the strength needed to challenge higher price levels.

Also, the 4-hour Composite Trend Oscillator for SOL is displaying positive signals, as both the SMA line and the signal line have risen above the zero level and are nearing the overbought zone. Typically, this movement indicates that buying pressure is intensifying, showing that buyers are becoming increasingly dominant in the market.
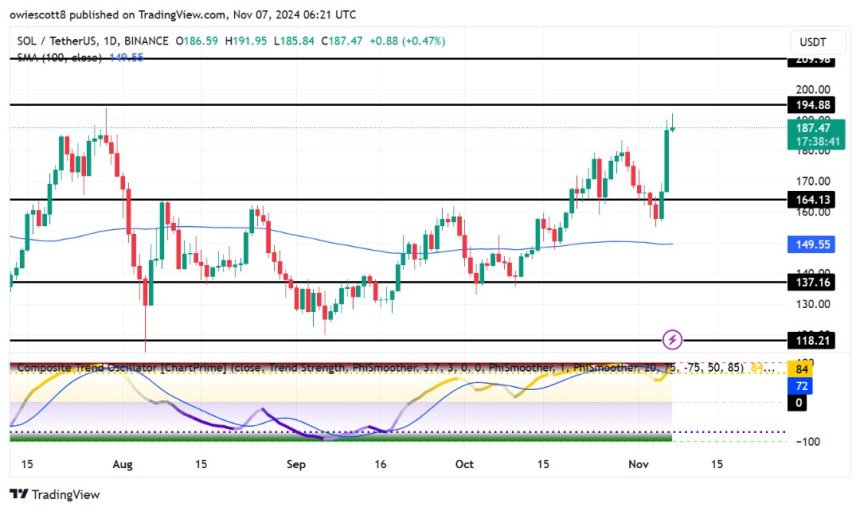
Additionally, the daily chart shows Solana is on a solid upward trajectory, underscored by a strong multiple bullish candlestick that reflects sustained buying pressure. SOL’s position above the 100-day SMA further supports this positive price action, reinforcing the likelihood of continued gains. Trading consistently above this key SMA signals strengthening positive sentiment, as buyers maintain control and push the price toward higher levels, possibly setting the stage for a test of upcoming resistance zones.

A closer look at the 1-day composite trend oscillator shows Solana in a bullish phase, with a crossover indicating strong upbeat momentum. As the indicator moves toward the overbought zone, it signals increasing buying strength and market enthusiasm, reflecting a potential for continued gains if optimistic sentiment holds.
What A Successful Breakout Could Mean For SOL’s Future
If SOL successfully breaks through the $194 resistance level, it could open the door for additional gains, with the next target being its all-time high of $209. A clear breach of this level may trigger a rally that may lead to the formation of new price highs, signaling continued bullish strength.
However, if SOL fails to breach $194, there is a risk of a pullback toward lower support levels, such as $164 or $137, where buyers may step in to stabilize the price.
What's Your Reaction?


