Shiba Inu Golden Cross Forming: Will SHIB Explode or Fake Out Again?
SHIB is flirting with a potential golden cross on the daily chart. Will it trigger a breakout or fizzle out? Here’s what traders should watch right now.

In crypto, chart patterns come and go. But the golden cross always gets attention. It’s simple, powerful, and for many traders, a flashing green light that something big might be brewing.
Right now, people are watching Shiba Inu (SHIB) because it’s inching closer to that exact setup.
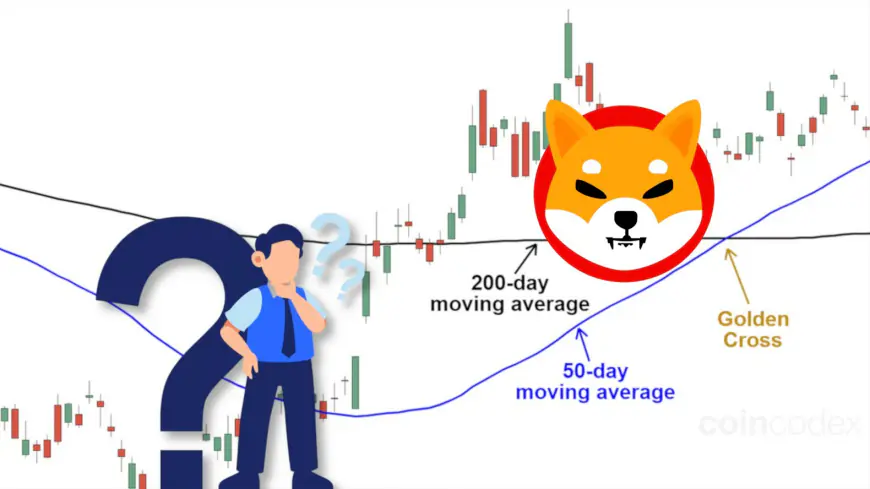
As of late May 2025, SHIB’s short-term trend (the 50-day moving average) is starting to climb toward its long-term trend (the 200-day moving average). If the 50-day line crosses above the 200-day, we get what’s called a golden cross. It often points to the start of a new bullish trend.
And with meme coins, signals like this can light a fire fast.
SHIB has already bounced over 35% from its April lows. It’s holding above key support, sentiment is shifting, and momentum is starting to build. If you’re holding SHIB (or thinking about whether you should), the next few weeks could be a turning point. A confirmed golden cross could pull in traders, spark headlines, and potentially send prices much higher.
Of course, nothing is guaranteed in this market. But the setup is there.
Key highlights:
- Shiba Inu (SHIB) is fairly close to a potential golden cross on the daily chart, where the 50-day MA is nearing a crossover above the 200-day MA.
- An hourly golden cross has already formed, which can signal early bullish momentum. But the daily crossover is the real trigger that traders are watching.
- If confirmed, the daily golden cross could push SHIB toward the next resistance around $0.000018, with potential upside of 30% or more.
- Previous golden cross attempts have failed due to weak volume and lack of support. Confirmation this time depends on follow-through buying.
- Traders should watch volume, support at $0.0000141, and resistance at $0.0000176–$0.0000182 to gauge whether this setup turns into a true breakout.
What is a golden cross in crypto?
Moving averages are some of the best trading indicators. A golden cross happens when the 50-day moving average (MA) crosses above the 200-day MA on a price chart. It’s a simple pattern, but it carries a lot of weight.
Why? Because this crossover suggests that short-term momentum is finally strong enough to flip the longer-term trend. It’s often seen as a sign that a downtrend is ending and a potential uptrend is just getting started.
The opposite is called a death cross (when the 50-day dips below the 200-day), and that usually signals bearish pressure ahead.
Here are some past examples of both golden and death crosses from Bitcoin’s chart:

While not foolproof, golden crosses are popular among swing traders and technical analysts because they’re easy to spot and can sometimes mark the beginning of big price moves.
Has Shiba Inu formed a golden cross yet?
Not quite. But it’s getting close.
At the time of writing, Shiba Inu (SHIB) is trading at $0.00001324, holding steady after a strong bounce off its April lows. That recovery has pushed SHIB above its 50-day moving average, and now the chart is showing early signs of something bigger brewing.
Traders have already spotted a golden cross on the hourly chart. It’s a smaller, shorter-term version of the pattern. That’s a good sign that momentum is shifting, but it’s the daily golden cross that really matters here.

Right now, SHIB’s 50-day moving average is trending sideways, but it’s close to crossing over the 200-day MA. If that crossover happens, it would mark SHIB’s first daily golden cross in months, potentially flipping the long-term outlook from neutral to bullish.
So no, it hasn’t happened yet. But the ingredients are there, and traders are watching closely.
Analyst commentary: What are experts saying?
- Hourly Golden Cross Sparks Optimism: U.Today reports that SHIB’s hourly chart flashed a golden cross. While hourly crosses carry less weight than daily ones, this early signal suggests short-term momentum is shifting in SHIB’s favor.
- Binance Says 33% Upside If Daily Cross Confirms: A recent analysis on Binance’s Square blog highlights that SHIB’s shorter-term MA is closing in on its longer-term MA. If a daily golden cross locks in, SHIB could surge toward the next major resistance at ~$0.00001864—a roughly 33% rally from today’s ~$0.000014 level.
- But Beware: Previous Cross Didn’t Hold: Not all crossovers pan out. U.Today also covered a case three weeks ago where SHIB “extended losses despite [its] rare bull pattern golden cross”. It’s a reminder that without strong support and follow-through, golden crosses can fizzle into false signals.
What could happen next? Bullish vs bearish scenarios
Bullish Scenario: Breakout Mode Engaged
If SHIB’s 50-day moving average completes the crossover above the 200-day and the price pushes past resistance near $0.0000176, we could see serious upside momentum.
Analysts are eyeing the $0.0000186 level as the next big target, with some even projecting a move toward $0.00002–$0.00003 if volume surges and sentiment heats up.
In this case, the golden cross could act as a launchpad for a fresh meme coin rally, pulling in swing traders, retail speculators, and hype.

Bearish Scenario: Another Fakeout?
On the flip side, if SHIB fails to break above that $0.0000176 resistance—or worse, drops below its 50-day moving average—we could be looking at another golden cross that fizzles. This already happened earlier, when a similar setup led to a brief price pop, followed by a dip back into the $0.000012 range.
Without strong volume and conviction behind the move, this bullish crossover could get ignored by the market. In that case, SHIB may drift sideways or drop in price.
In short, the setup looks fairly good for now, but it needs a spark.
How have golden crosses played out before?
Golden crosses don’t always guarantee fireworks. But when they hit the world of meme coins, they can hit hard.
- Dogecoin (DOGE) is a prime example. In late 2024, DOGE flashed a golden cross on the 4-hour chart. What followed? A monster rally—over 180% in just eight days, jumping from ~$0.15 to over $0.42. The setup combined with strong community hype and market tailwinds, and the resulted was explosive.
- Pepe (PEPE) is another recent case. In May 2025, analysts flagged a pending golden cross as PEPE formed a rounded bottom, a classic bullish pattern. While the full breakout hadn't been confirmed at the time, technical traders saw it as a sign that momentum was building. And it was. Pepe is up almost 60% in the last month alone.
- Shiba Inu, however, has a more mixed history. Earlier in May 2025, SHIB briefly formed a crossover, but the move stalled fast. Price dropped back below support, and the signal faded. That failed rally reminds us: golden crosses need fuel. That means volume, demand, and conviction.
So while history shows golden crosses can trigger big runs, it doesn’t always happen. In SHIB’s case, the setup is forming, but the follow-through will decide the story.
What traders should watch for
If you’re eyeing SHIB for a possible move, here are the key signals to track:
Confirmation of the daily golden cross
This is the big one. The moment the 50-day MA cleanly crosses above the 200-day MA (ideally with price moving in the same direction), you’ve got technical confirmation.
But don’t just rely on the lines crossing. What matters is whether buyers show up after the cross.
Trading volume
Volume is the fuel behind any real breakout. A golden cross with low volume? That’s a red flag. If SHIB’s volume spikes alongside the crossover, that’s a much stronger sign that momentum is real. And that it’s sustainable.
Support & resistance levels
- Support to hold: Around $0.0000141, where SHIB has bounced several times.
- Short-term floor: The 50-day MA (~$0.0000134).
- Key resistance: Between $0.0000176–$0.0000182. If SHIB breaks this zone with force, it could be game on.
Market sentiment
Keep an eye on what’s happening with Bitcoin and other meme coins like DOGE and PEPE. In fact, Bitcoin recently had its old golden cross.
Meme coin rallies are often herd movements. If one pops, others usually follow. A rising tide lifts all dog tokens.
On-hain activity
If exchange inflows spike or wallet activity drops, that could signal selling pressure ahead. Tools like Santiment, Lookonchain, or Whale Alert can give you a pulse on behind-the-scenes moves.
The bottom line
Shiba Inu hasn’t crossed into golden cross territory just yet.
The setup is forming, the short-term trend is turning bullish, and momentum is building. Traders have already spotted a golden cross on the hourly chart, and now all eyes are on the daily chart to see if the 50-day MA can push above the 200-day.
If that happens—and it’s backed by solid volume—SHIB could be gearing up for a strong breakout. Analysts are already talking about a potential 30%+ rally if resistance at $0.000018 gets taken out.
But crypto rarely hands out easy wins. The last time SHIB flashed a bullish crossover, it didn’t stick. A lack of volume and weak support dragged the price back down. That’s the risk you need to weigh: Is this setup for real, or just another fakeout? For now, SHIB is in a holding pattern.
Even if Shiba Inu forms a golden cross, SHIB is unlikely to ever reach 1 cent due to its inflated supply.
What's Your Reaction?


