Polygon’s Potential Surge: Navigating Bullish Signals Amidst Concerning Metrics
Polygon’s (MATIC) market position is a mix of bearish trends and bullish patterns, indicating potential for future gains. Critical resistance at $1.11 and varying metrics present challenges, yet underlying support levels offer hope for resilience. Polygon (MATIC) has recently drawn significant attention from investors and analysts alike. Following a period of notable growth last week, [...]


- Polygon’s (MATIC) market position is a mix of bearish trends and bullish patterns, indicating potential for future gains.
- Critical resistance at $1.11 and varying metrics present challenges, yet underlying support levels offer hope for resilience.
Polygon (MATIC) has recently drawn significant attention from investors and analysts alike. Following a period of notable growth last week, MATIC’s daily chart has taken a bearish turn. Despite this shift, current trends suggest that the token is transitioning out of a bullish pattern, potentially setting the stage for future gains.
Polygon journey over the past week has been marked by contrasting trends. Initially, investors enjoyed a profitable phase as MATIC’s value surged by over 4%, a commendable achievement in the volatile crypto market. However, the landscape quickly changed, with the token’s price experiencing a 2% decline in the last 24 hours, as reported by CoinMarketCap.
At the time of writing, MATIC was trading at $0.9997, representing a 1.28% increase in the last 24 hours and a decrease of 1.07% in the last week.. It boasting a substantial market capitalization exceeding $9.4 billion.
MATIC Technical Analysis and Market Signals
Further insights into MATIC’s trajectory were provided by World of Charts, which highlighted the token’s exit from a bullish triangle pattern on X (formerly known as Twitter). This technical movement often signifies a potential for upcoming bullish momentum, drawing keen interest from market participants.


Finally Breakout & Retest Has Confirmed As Exoected Massive Volume Coming In Expecting Massive Bullish Wave Can Start Anytime Now As The Trend Is Up In #Crypto Its Easy To Find Entries With In Direction Of Trend https://t.co/m47r0ajzHi pic.twitter.com/SSg5lrCquC
— World Of Charts (@WorldOfCharts1) February 24, 2024
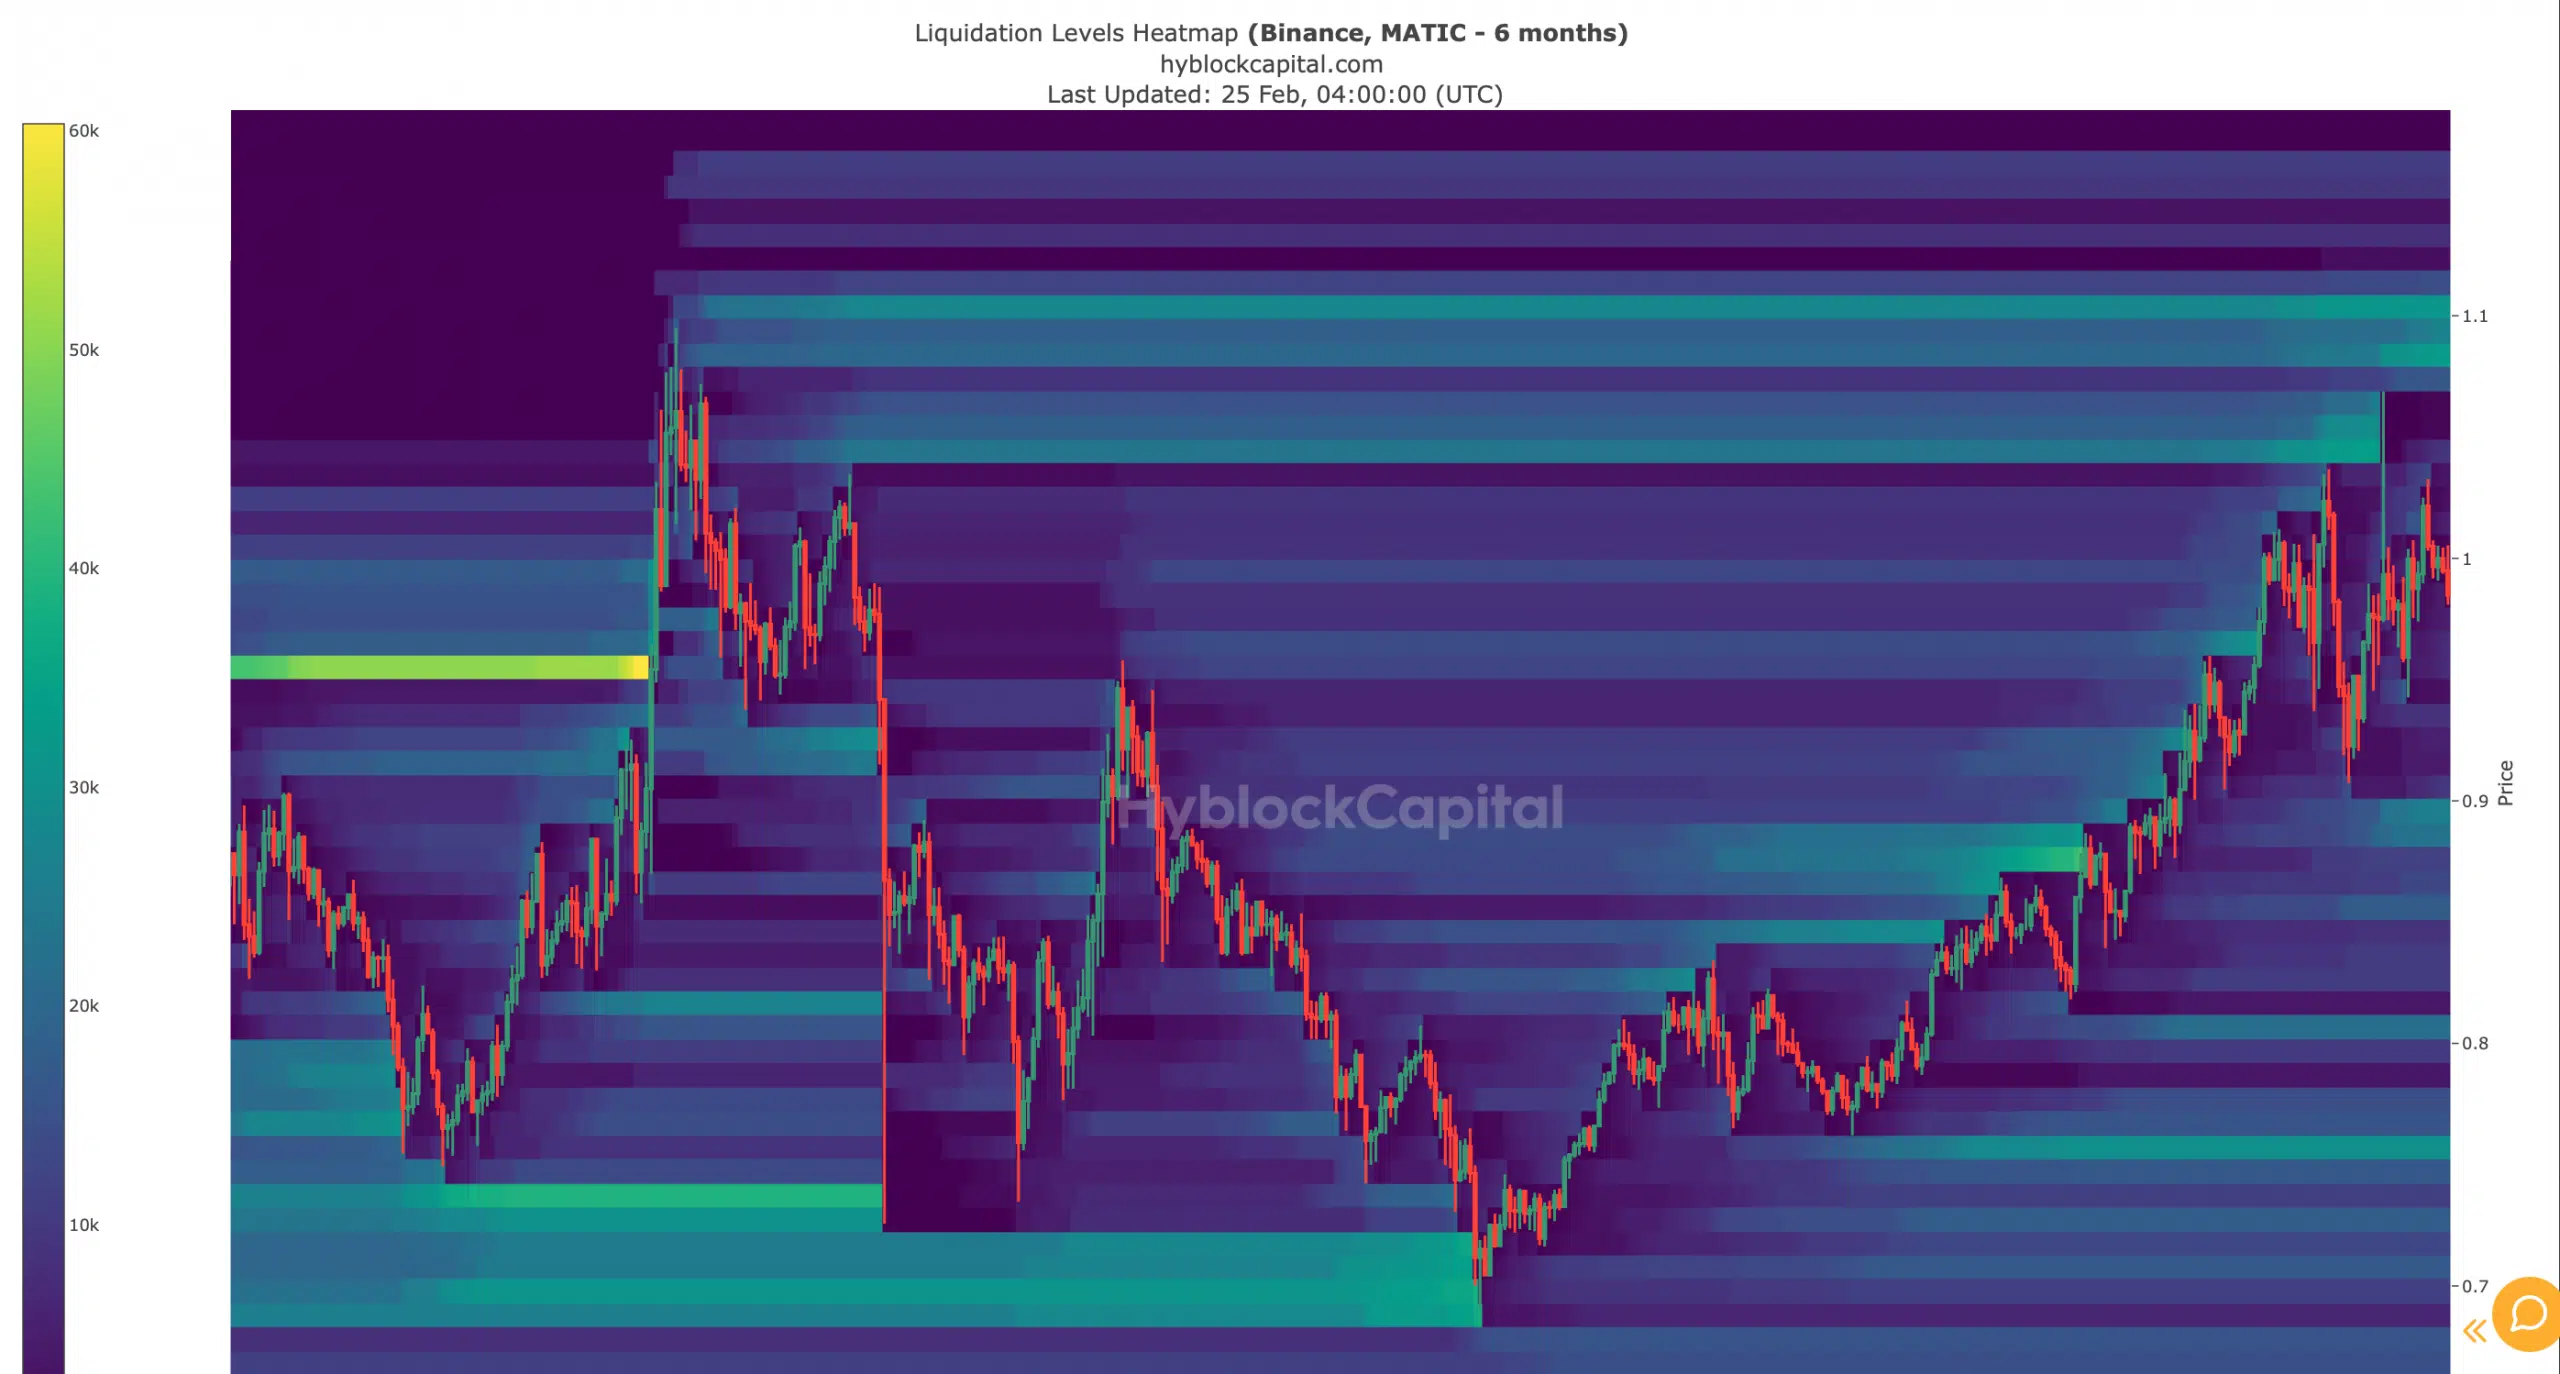
However, challenges lie ahead. MATIC’s liquidation heatmap indicates a strong resistance zone near the $1.11 mark. Should the token approach this threshold, increased liquidation may trigger selling pressure, thereby impacting its price negatively. This aspect of market dynamics underscores the intricate balance between bullish optimism and the realities of resistance levels.
Delving into MATIC’s Metrics
Another notable observation was the decrease in MATIC’s exchange reserve, as highlighted by CryptoQuant’s data. This trend typically signals reduced selling pressure, a positive sign for bullish investors. Yet, other metrics paint a more complex picture.
The MVRV ratio’s recent dip, coupled with the stagnation in accumulation by top addresses, suggests a cautious stance among major stakeholders. Additionally, a slight decline in network activity, as evidenced by a reduction in daily active addresses, adds another layer to the analysis.
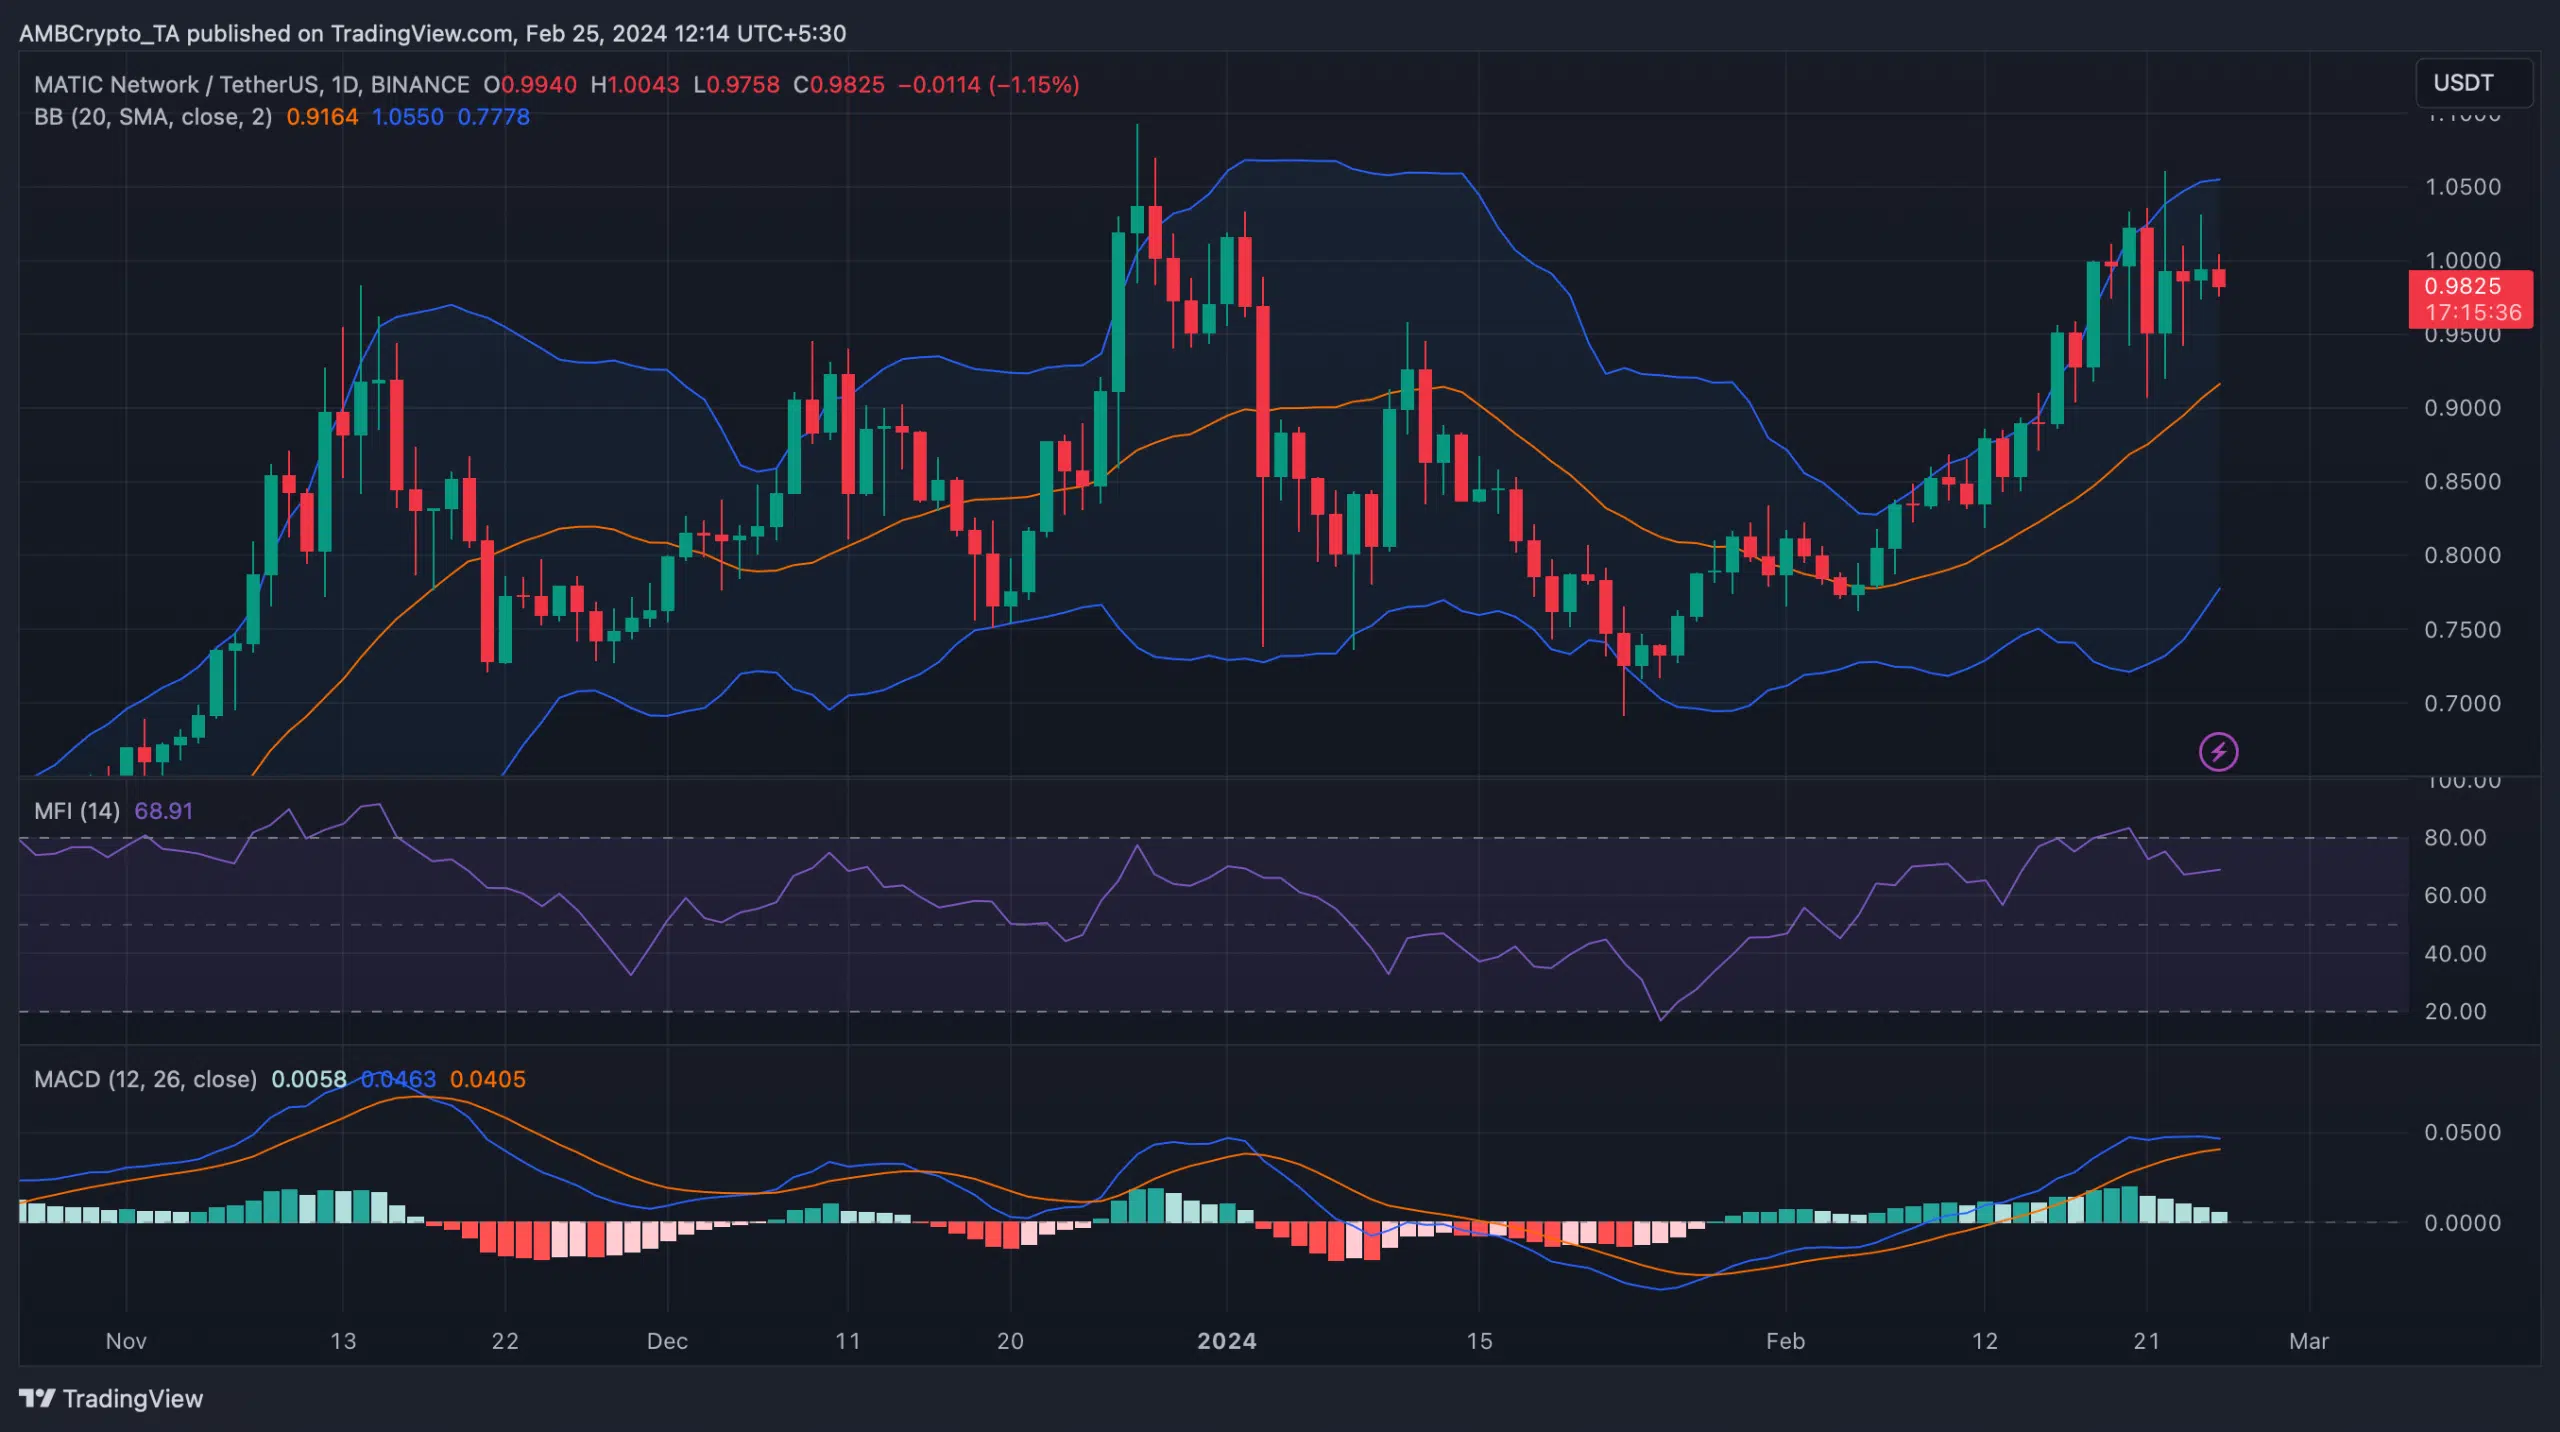
Technical indicators further elaborate on Polygon crypto’s market position. The MACD hints at a potential bearish crossover, while a touch on the upper Bollinger band led to a minor price correction.
Despite these bearish signals, the Money Flow Index remains robustly above the neutral mark, and MATIC’s standing above its 20-day SMA provides a glimmer of support that could catalyze a rebound. To dive deeper into the potential of this crypto, you can watch this YouTube video.
What's Your Reaction?