Is $135,000 Bitcoin’s Current Ceiling? This Model Says So
The CryptoQuant founder has shared a model for Bitcoin that suggests the cryptocurrency’s maximum price could lie around $135,000 right now. Bitcoin Model Established On Realized Cap Could Reveal Price Ceiling & Floor In a new post on X, CryptoQuant founder and CEO Ki Young Ju has discussed about a BTC pricing model that’s based on the Realized Cap. The “Realized Cap” here refers to an on-chain valuation model for Bitcoin that assumes the ‘real’ value of any coin in circulation is the price at which it was last transacted on the blockchain. Related Reading: Dogecoin Price Down 7%, But Whales Continue To Buy For any token, its last transfer is likely to represent the last instance of it changing hands, so the price at its time could be considered as the token’s current cost basis. As such, the Realized Cap is a sum of the cost basis of all coins on the network. Put another way, the Realized Cap measures the total amount of capital that the holders of the cryptocurrency as a whole have invested into it. A new metric can be derived from this indicator by dividing it by the total circulating supply, representing the cost basis for the average token or investor on the chain. This indicator is known as the Realized Price. In the context of the current topic, the Realized Price itself isn’t of interest, but its two multipliers are: 3.9x and 0.75x. Below is the chart shared by Young Ju that shows the trend in these two multipliers of the Realized Price over the history of Bitcoin. In the graph, the CryptoQuant founder has marked the 3.9x multiplier of the Realized Price as BTC’s “ceiling price.” Similarly, the 0.75x multiplier represents the “floor price.” An inspection of the trend in the indicator during the past cycles reveals why the analyst has chosen to do so. It turns out that the asset has generally topped at or slightly above the 3.9x multiplier, while it has reached bottoms at or slightly under the 0.75x multiplier. At present, the ceiling price for the asset is sitting at a value of around $135,741, while the floor price at $26,104. Bitcoin is much higher than the latter right now, but there is also an appreciable distance to the former. Related Reading: Bitcoin Retail Is Finally Back: These Metrics Point To An Explosion In Interest This means that at the current amount of capital invested into the cryptocurrency, it still has room for growth, at least going by the pattern observed throughout history. Naturally, the ceiling price isn’t something that’s certain to remain where it is now for the rest of the bull run, since any further fresh capital inflows into the asset would raise it. But for now, under $136,000 is looking like Bitcoin’s upper limit. BTC Price The Bitcoin rally has hit a pause button recently as the coin’s value is still trading around $90,000 right now. Featured image from Dall-E, CryptoQuant.com, chart from TradingView.com

The CryptoQuant founder has shared a model for Bitcoin that suggests the cryptocurrency’s maximum price could lie around $135,000 right now.
Bitcoin Model Established On Realized Cap Could Reveal Price Ceiling & Floor
In a new post on X, CryptoQuant founder and CEO Ki Young Ju has discussed about a BTC pricing model that’s based on the Realized Cap. The “Realized Cap” here refers to an on-chain valuation model for Bitcoin that assumes the ‘real’ value of any coin in circulation is the price at which it was last transacted on the blockchain.
For any token, its last transfer is likely to represent the last instance of it changing hands, so the price at its time could be considered as the token’s current cost basis. As such, the Realized Cap is a sum of the cost basis of all coins on the network.
Put another way, the Realized Cap measures the total amount of capital that the holders of the cryptocurrency as a whole have invested into it. A new metric can be derived from this indicator by dividing it by the total circulating supply, representing the cost basis for the average token or investor on the chain.
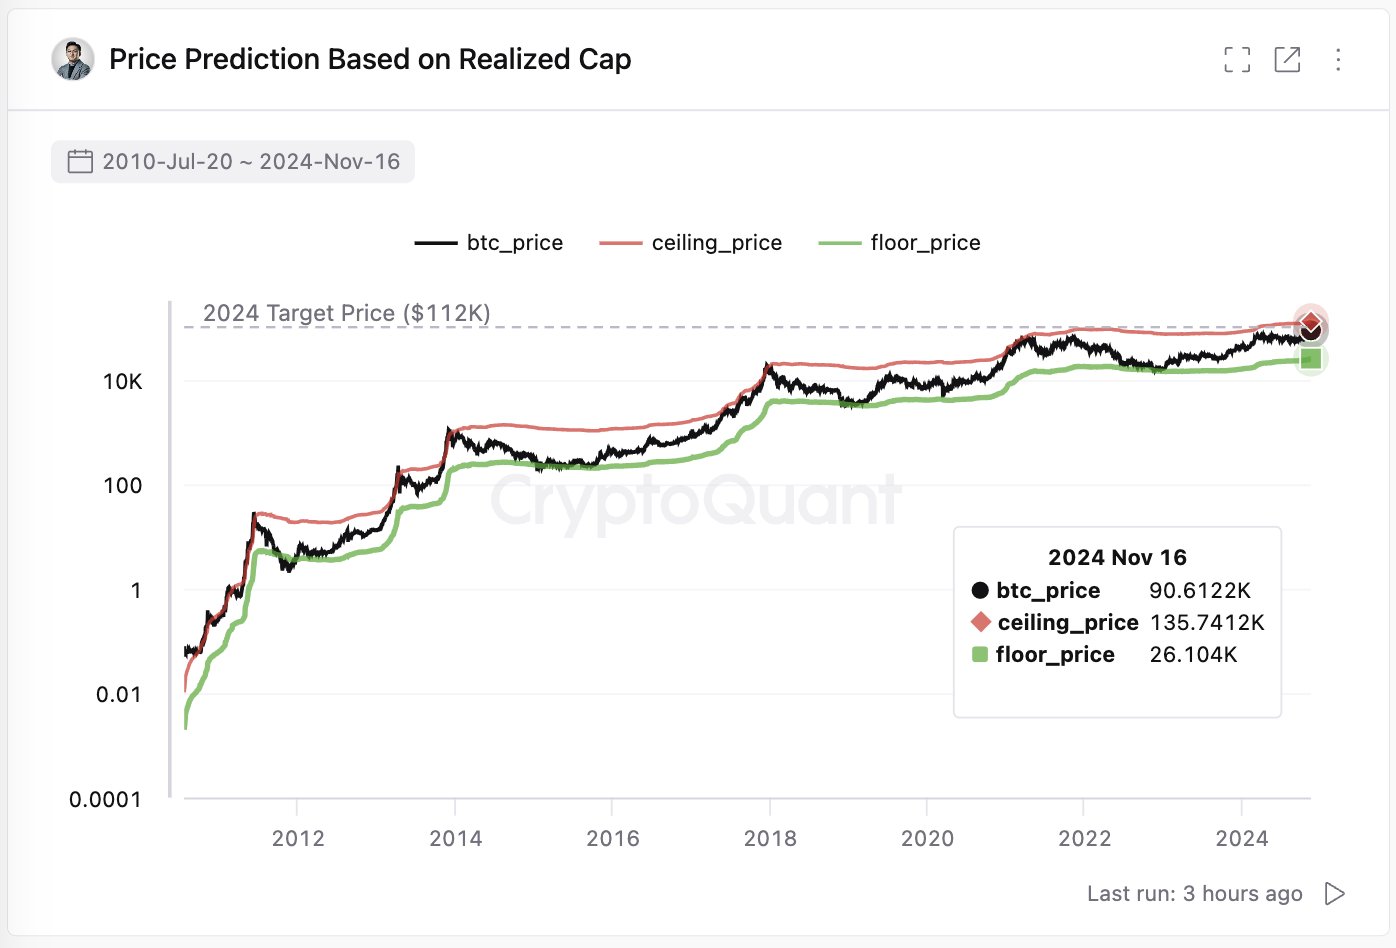
This indicator is known as the Realized Price. In the context of the current topic, the Realized Price itself isn’t of interest, but its two multipliers are: 3.9x and 0.75x. Below is the chart shared by Young Ju that shows the trend in these two multipliers of the Realized Price over the history of Bitcoin.

In the graph, the CryptoQuant founder has marked the 3.9x multiplier of the Realized Price as BTC’s “ceiling price.” Similarly, the 0.75x multiplier represents the “floor price.” An inspection of the trend in the indicator during the past cycles reveals why the analyst has chosen to do so. It turns out that the asset has generally topped at or slightly above the 3.9x multiplier, while it has reached bottoms at or slightly under the 0.75x multiplier.
At present, the ceiling price for the asset is sitting at a value of around $135,741, while the floor price at $26,104. Bitcoin is much higher than the latter right now, but there is also an appreciable distance to the former.
This means that at the current amount of capital invested into the cryptocurrency, it still has room for growth, at least going by the pattern observed throughout history.
Naturally, the ceiling price isn’t something that’s certain to remain where it is now for the rest of the bull run, since any further fresh capital inflows into the asset would raise it. But for now, under $136,000 is looking like Bitcoin’s upper limit.
BTC Price
The Bitcoin rally has hit a pause button recently as the coin’s value is still trading around $90,000 right now.
What's Your Reaction?


