


Bitcoin Price Rises Again—Are Bulls Charging Toward a New All-Time High?
Bitcoin price started a fresh increase above the $106,000 zone. BTC is now consolidating and might attempt to clear the $110,500 resistance. Bitcoin started a fresh upward move above the $107,000 zone. The price is trading above $107,000 and the 100 hourly Simple moving average. There is a bullish trend line forming with support at $106,850 on the hourly chart of the BTC/USD pair (data feed from Kraken). The pair could start a fresh decline if it breaks the $105,000 support zone. Bitcoin Price Gains Pace Bitcoin price started a fresh increase after it settled above the $103,500 support zone. BTC was able to surpass the $104,400 and $105,000 resistance levels. The bulls even pumped the price above the $108,000 resistance. A high was formed at $110,550 and the price is now consolidating gains above the 23.6% Fib retracement level of the upward move from the $100,400 swing low to the $110,550 high. Bitcoin is now trading above $108,000 and the 100 hourly Simple moving average. There is also a bullish trend line forming with support at $106,850 on the hourly chart of the BTC/USD pair. On the upside, immediate resistance is near the $110,000 level. The first key resistance is near the $110,500 level. The next key resistance could be $112,500. A close above the $112,500 resistance might send the price further higher. In the stated case, the price could rise and test the $113,800 resistance level. Any more gains might send the price toward the $115,000 level. Another Decline In BTC? If Bitcoin fails to rise above the $110,500 resistance zone, it could start another decline. Immediate support is near the $108,200 level. The first major support is near the $106,500 level and the trend line. The next support is now near the $105,500 zone and the 50% Fib retracement level of the upward move from the $100,400 swing low to the $110,550 high. Any more losses might send the price toward the $103,500 support in the near term. The main support sits at $102,000, below which BTC might gain bearish momentum. Technical indicators: Hourly MACD – The MACD is now gaining pace in the bullish zone. Hourly RSI (Relative Strength Index) – The RSI for BTC/USD is now above the 50 level. Major Support Levels – $108,000, followed by $106,500. Major Resistance Levels – $110,500 and $112,500.

Bitcoin price started a fresh increase above the $106,000 zone. BTC is now consolidating and might attempt to clear the $110,500 resistance.
- Bitcoin started a fresh upward move above the $107,000 zone.
- The price is trading above $107,000 and the 100 hourly Simple moving average.
- There is a bullish trend line forming with support at $106,850 on the hourly chart of the BTC/USD pair (data feed from Kraken).
- The pair could start a fresh decline if it breaks the $105,000 support zone.
Bitcoin Price Gains Pace
Bitcoin price started a fresh increase after it settled above the $103,500 support zone. BTC was able to surpass the $104,400 and $105,000 resistance levels.
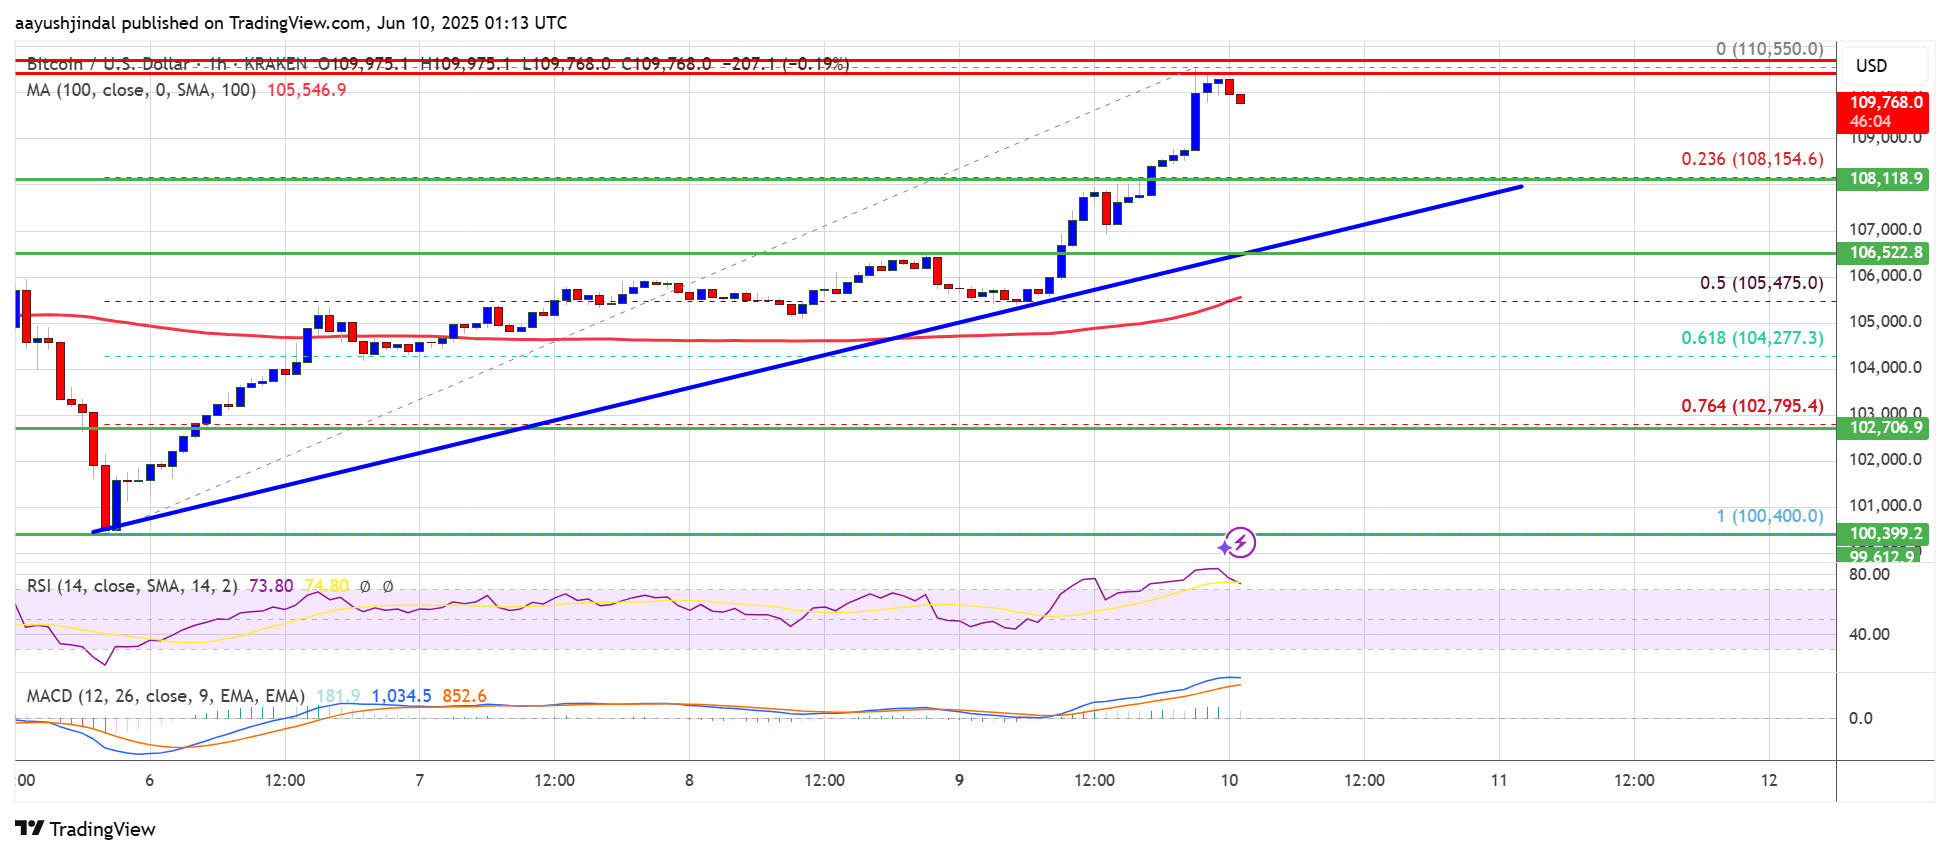
The bulls even pumped the price above the $108,000 resistance. A high was formed at $110,550 and the price is now consolidating gains above the 23.6% Fib retracement level of the upward move from the $100,400 swing low to the $110,550 high.
Bitcoin is now trading above $108,000 and the 100 hourly Simple moving average. There is also a bullish trend line forming with support at $106,850 on the hourly chart of the BTC/USD pair.
On the upside, immediate resistance is near the $110,000 level. The first key resistance is near the $110,500 level. The next key resistance could be $112,500. A close above the $112,500 resistance might send the price further higher. In the stated case, the price could rise and test the $113,800 resistance level. Any more gains might send the price toward the $115,000 level.
Another Decline In BTC?
If Bitcoin fails to rise above the $110,500 resistance zone, it could start another decline. Immediate support is near the $108,200 level. The first major support is near the $106,500 level and the trend line.
The next support is now near the $105,500 zone and the 50% Fib retracement level of the upward move from the $100,400 swing low to the $110,550 high. Any more losses might send the price toward the $103,500 support in the near term. The main support sits at $102,000, below which BTC might gain bearish momentum.
Technical indicators:
Hourly MACD – The MACD is now gaining pace in the bullish zone.
Hourly RSI (Relative Strength Index) – The RSI for BTC/USD is now above the 50 level.
Major Support Levels – $108,000, followed by $106,500.
Major Resistance Levels – $110,500 and $112,500.
What's Your Reaction?