Bitcoin Monthly Chart: Signals Show Mixed Trends and Market Uncertainty
Alan Santana highlights mixed signals on the Bitcoin monthly chart, showing potential market uncertainty. Low volume and altcoin divergence suggest Bitcoin’s rally lacks broad market support. Popular analyst Alan Santana offers insights on Bitcoin’s current state in a TradingView analysis, stressing the complexity of the signals observed in the monthly chart. Santana starts his analysis [...]


- Alan Santana highlights mixed signals on the Bitcoin monthly chart, showing potential market uncertainty.
- Low volume and altcoin divergence suggest Bitcoin’s rally lacks broad market support.
Popular analyst Alan Santana offers insights on Bitcoin’s current state in a TradingView analysis, stressing the complexity of the signals observed in the monthly chart.
Santana starts his analysis by noting the “tricky situation” that Bitcoin’s movements create since the chart provides several readings depending on one’s viewpoint. Technical analysis offers consistent signals, and nevertheless, the subtleties of market mood and outside factors can change the interpretation of these signals.
Conflicting Signals Highlight Bitcoin Uncertain Market Momentum
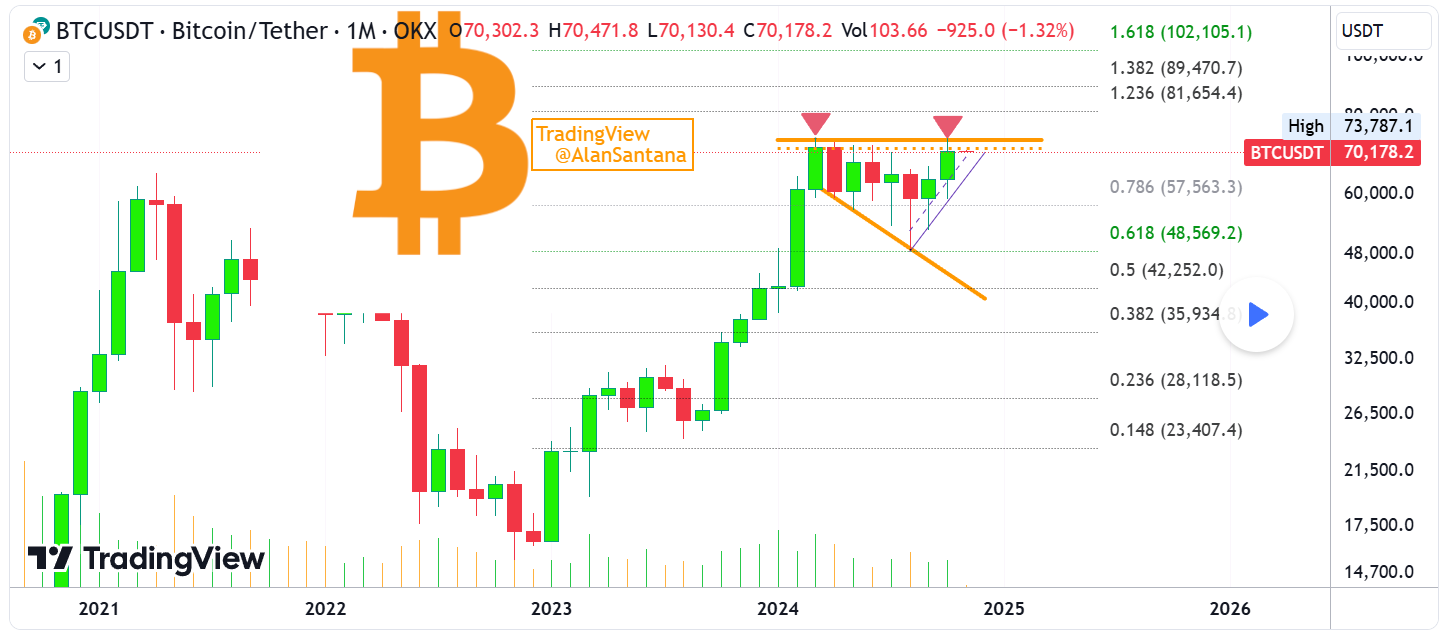
Santana starts by looking at the latest monthly performance of Bitcoin. Breaking an otherwise alternating trend of red and green monthly candles, this month notably represents the first time two consecutive green closes since Bitcoin’s top in March 2024.

Still, volume paints a different tale even with this strong ending. Santana emphasizes the shockingly low trade volume, among the lowest in years, indicating possible weakness even with price increases. Moreover, the monthly RSI has dropped, and October closed at 66 instead of the 76 of March.
The RSI is currently at 59.90, down from a previous high of 88, which highlights the strong bearish divergence in this change when looking at weekly data. Such differences usually indicate approaching downward pressure, a fundamental fact Santana emphasizes.
The MACD, which shows a usual pattern for a bullish increase with a growing curve on the monthly level, adds to the intricacy, and the histogram has been declining since March. But unlike other bearish warnings, the weekly MACD shows a strong positive cross, therefore clouding the view.
October’s candlestick pattern finished in a neutral form, neither clearly supporting a bullish or a bearish trend. Santana says these conflicting signals show the unpredictability of the market since both support and opposition levels are challenged but not clearly disrupted.
Bitcoin-Altcoin Dynamics: A Key Indicator for Market Direction
Santana separates his study into two parts: objective technical observations and his own judgments. Objectively, the monthly chart of Bitcoin shows a double-top pattern, a classic reversal indicator implying a possible downslip. Together with ultra-low volume, this trend usually comes before a market correction.
Santana notes, nevertheless, that low volume could also indicate that notable movement is still to come and allow for several readings. Though the lack of general altcoin growth is another warning indication, the positive momentum observed in recent months counters the double-top.
Usually, altcoins perform in line with Bitcoin during bull runs, and the lack of such movement across the altcoin market suggests that the expansion of Bitcoin is isolated and maybe unsustainable.
Fascinatingly, Santana notes that the interaction of Bitcoin with altcoins can serve as a gauge for further developments. Altcoins often see significant increases when Bitcoin consolidates or encounters opposition; several assets have gained between 200 and 300 percent during recent halts.
Historically, a growing altcoin market supports the optimistic possibilities of Bitcoin. On the other hand, if Bitcoin halts and altcoins start to fall, it could mean that Bitcoin is about to tumble.
This association was clear in 2021, when altcoins peaked in April or May but Bitcoin kept rising to a higher high in November, therefore deviating from the general altcoin market. Santana links some of this to inflation during the COVID-19 epidemic, which distorted the chart, as Bitcoin’s higher high served as an unusual correction impacted by an increased money supply.
Limited Investor Participation May Hinder Bitcoin Bull Run Potential
The market now shows like tendencies. Bitcoin is reaching new all-time highs, while Ethereum and other big altcoins trade at rather low levels, implying that just a small portion of investors are riding this surge.
Santana underlines that the present situation does not completely support a lasting bull cycle since a complete involvement across the market is necessary for this scenario. He notes that the lack of participation from a larger player base causes most of the market to remain unchanged while Bitcoin experiences expansion, an imbalance that might restrict the surge of the currency.
Santana ends with a projection showing a decline most probable before Bitcoin achieves a new significant peak. He declares that a Fibonacci extension level of $102,000 is the next important objective, but he warns that reaching this level might trigger a significant decline.
Corrections in both directions can startle market players, he observes, sometimes clearing out holdings as they surpass expectations.
With Santana estimated that 95% of long positions might be liquidated during a severe downturn, Bitcoin’s negative corrections can reach depths that liquidate a sizable amount of leveraged holdings, much as it has the capacity to surpass optimistic targets during a rally.
Meanwhile, as of writing, BTC is trading at about $69,308.19, down 4.34% over the last 24 hours.
What's Your Reaction?


