


AMP Price Prediction 2024-2030: Is AMP a Good Investment?
Key Takeaways Amp seeks to enable users to stake tokens without having to transfer them to a smart contract physically. This function makes Amp suitable for any form of value exchange, including digital payments, traditional currency exchange, loan distributions, real estate transactions, and more. Staking Amp seeks to improve overall utility by increasing in proportion to the […]
Key Takeaways
- AMP price predictions hint at a maximum price of $0.01 by the end of 2024 while maintaining an average price of $0.0088.
- In 2025, the price of AMP will range between $0.0129 and $2.28, with an average price of $0.0144.
- In 2030, AMP will range between $0.0877 and $15.43, with an average price of $0.1066.
Amp seeks to enable users to stake tokens without having to transfer them to a smart contract physically. This function makes Amp suitable for any form of value exchange, including digital payments, traditional currency exchange, loan distributions, real estate transactions, and more.
Staking Amp seeks to improve overall utility by increasing in proportion to the number of users and transactions (e.g., customers, wallets, merchants) that join the network. As a result of technological innovations, Amp seeks to drive network economic growth through adoption and payment volume (i.e., productivity output).
Overview
| Cryptocurrency | Amp |
| Token | AMP |
| Price | $0.006827 |
| Market Cap | $288,286,615 |
| Trading Volume | $13,935,576 |
| Circulating Supply | 42,227,702,186 |
| All-time High | $0.1211 June 16, 2021 |
| All-time Low | $0.0007946 Nov 18, 2020 |
| 24 High | $0.007173 |
| 24 Low | $0.006751 |
AMP Price Prediction: Technical Analysis
| Metric | Value |
| Volatility | 4.67% |
| 50-Day SMA | $0.007925 |
| 100-Day SMA | $0.007456 |
| Sentiment | Bullish |
| Fear & Greed | 76 (Extreme Greed) |
| Green Days | 12/30 (40%) |
AMP price analysis: Cryptocurrency devalues to $0.00686 amidst its descent
TL; DR Breakdown
- The AMP price analysis depicts negative market sentiment.
- Coin value has dropped down to $0.00686 low.
- Support remained available at $0.00664 extreme.
The latest one-day and four-hour AMP price analysis for May 24, 2024, indicates a highly bearish shift in market dynamics today. The selling activity continues to rise this week as the Red candlesticks demarcate their territories on the one-day price chart. During the last 24 hours, the bears remained quite consistent with their efforts as the cryptocurrency value stumbled to $0.00686. Because of the heightening chances of an extensive downward wave, investors should sustain careful inspection prior to investing in the cryptocurrency.
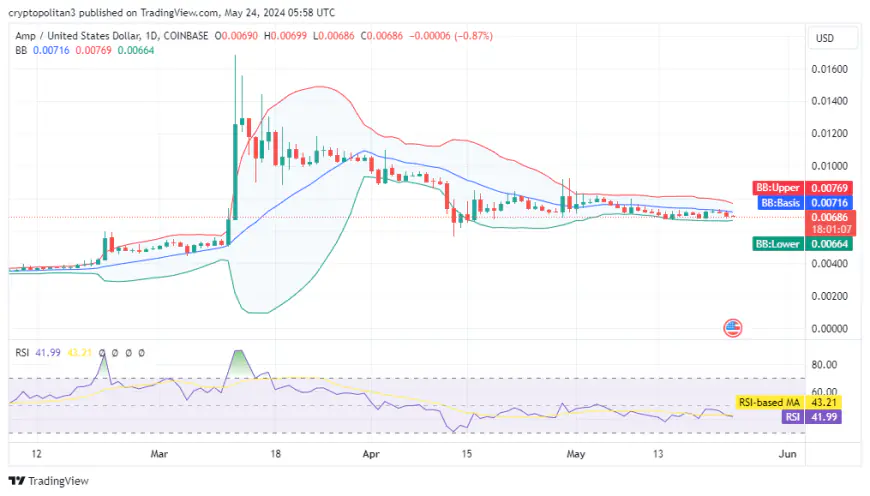
AMP price analysis 1-day chart: A downward trend persists as AMP sinks to $0.00686.
The recent one-day AMP price analysis predicts signs of a highly bearish scenario regarding the latest market events. The price movements have been constantly fluctuating this month because of the constant reversal of market trends. Currently, however, the sellers seem to be in the dominant position, as the rising bearish sentiment has led to losses below the $0.00686 marker. Likewise, because of the intensifying bearish activity, the Moving Average (MA) value has also faced deterioration. Because of the constant downswing over the past few weeks, the AMP/USD price has shifted below the Moving Average curve. Currently, the Moving Average value is situated at the $0.00703 position, slightly higher than the coin value.

The volatility seems to be on the decline, which once again forecasts an impending change in the cryptocurrency value. The converging bands of the Bollinger bands indicator dictate an upcoming bullish shift in price movements. A significant recovery in the AMP/USD value may be spotted sometime in the near future. If we discuss the Bollinger bands indicator, then its upper boundary is at $0.00769, representing resistance. Whereby, its lower band is at $0.00664, indicating unreliable support. The Relative Strength Index (RSI) indicator, as a significant technical indicator, confirms the growing selling momentum. With a 41.99 RSI score, the cryptocurrency is slowly moving towards the danger zone. The receding change in the RSI value indicates a downward shift, which sets an alarm for future investments.
AMP/USD 4-hour price chart: AMP declines below $0.00686 amidst bearish drift
The recent four-hour AMP price analysis paves the way for a bearish takeover in the coming hours of the day. In the past four hours, a major setback paved the way for a strong bearish comeback, which has destabilized the ongoing development. The selling activity seems stronger than the buying activity for now, which has led to a major slump down to $0.00686. The heightening bearish activity since the last four hours has resulted in a depreciation below $0.00686. Moving on, the Moving Average indicator confirms the intensifying bearish sentiment, as it has shifted above the current price. The continual downfall in the coin value has reduced the Moving Average value to $0.0070, indicating a bearish trend.
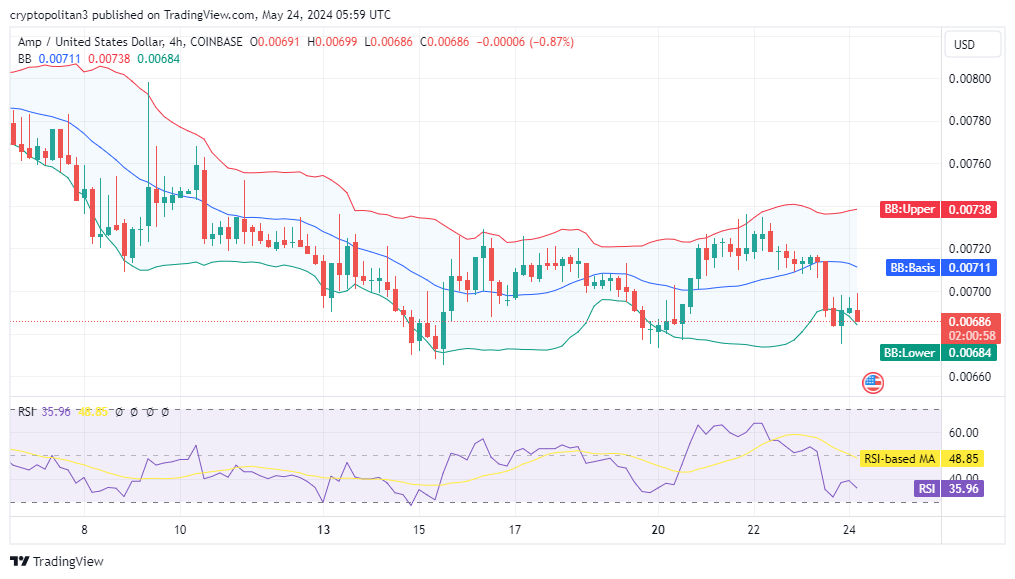
The expanding volatility is suggestive of a major shift in the current market trends in either direction. The volatility seems to be rising significantly, which creates the possibility of a major bearish wave in the coming hours. As a consequence, the current price movements may follow in the span of the upcoming hours. This paves the way for thorough monitoring of the ongoing market developments, as the current scenario creates more opportunities for bearish movements.
The upper limit of the Bollinger bands indicator is secure at the $0.00738 limit, indicating strong resistance. Whereby, the lower limit of the Bollinger bands indicator is set at $0.00684, pointing at available support. The RSI indicator also confirms the downward swing, as its overall value has sunk to index 35.96. If the current price movement intensifies, it is expected that the RSI value will soon enter the underbought region.
AMP Technical Indicators: Levels and Action
Daily Simple Moving Average
| Period | Value ($) | Action |
| SMA 3 | 0.007397 | SELL |
| SMA 5 | 0.007296 | SELL |
| SMA 10 | 0.007054 | BUY |
| SMA 21 | 0.00736 | SELL |
| SMA 50 | 0.007925 | SELL |
| SMA 100 | 0.007456 | SELL |
| SMA 200 | 0.005149 | BUY |
Daily Exponential Moving Average
| Period | Value | Action |
| EMA 3 | 0.007374 | SELL |
| EMA 5 | 0.007496 | SELL |
| EMA 10 | 0.007586 | SELL |
| EMA 21 | 0.00773 | SELL |
| EMA 50 | 0.007863 | SELL |
| EMA 100 | 0.00712 | BUY |
| EMA 200 | 0.005794 | BUY |
What to expect from AMP price analysis next?
The latest one-day and four-hour AMP price analysis indicates a highly bearish scenario for the ongoing market events. The bears remained on the leading end in the past 24 hours, as the rising selling activity has led to a loss below $0.00686. This is because selling activity remained relatively high compared to buying pressure. A similar price movement was recorded over the past four hours of the day, consolidating the bearish rule over the market in the present moment.
Is AMP A Good Investment?
AJ Five asserts that a hike in AMP’s overall value, which brings the Amp token value up from $0.004 to $0.0045, may be observed soon. Side by side, an abrupt fall in the coin value may be observed as well. That is because this sort of rapid rise and fall is a key characteristic of the crypto market, where certain periods require thorough and wise decision-making from investors. Moreover, some crypto investors have suggested that the approaching weeks can bring a steady rise in the cryptocurrency’s value. In the latter part of this year (2024), a bullish rally may be expected, which can potentially transport the amp price value above $0.01.
Recent AMP News
- AMP/USDT is currently in an uptrend, forming higher highs (HHs) and higher lows (HLs) above the 200EMA. The price is consolidating sideways in the correction phase and is expected to break out of the trendline soon. Bullish momentum will likely continue upon breakout, testing the previous swing high.
- AMP, the native token of the Amp cryptocurrency project, has witnessed a 22% price surge despite the broader market downturn, which saw Bitcoin plunge below the $62,000 mark some three weeks ago.
- According to our technical analysis, AMP’s price breakout from a descending channel has been a key factor in its recent upward momentum. AMP is also trending on Binance, while Bitcoin and Ethereum have plunged amidst the market bloodbath.
AMP Price Prediction May 2024
Amp could break out lower from current levels. A break below 40 RSI will necessitate a steep reversal. This month, Amp will trade between $0.0068 and $0.02300. With an average of $0.0088.
AMP Price Prediction
Potential Low
Potential Average
Potential High
AMP Price Prediction May 2024
$0.0068
$0.0088
$0.02300
AMP Price Prediction 2024
For 2024, Amp’s price trajectory suggests a maximum Amp price prediction of $0.0100, which is almost 30% higher than the current Amp price. The minimum price is expected to align at $0.0086, with the year’s average trading price estimated to be around $0.0088.
AMP Price Prediction
Potential Low
Potential Average
Potential High
AMP Price Prediction 2024
$0.0086
$0.0088
$0.0100
AMP was a bit late to follow Bitcoin’s bullish moves, but it finally made the jump and reached the highest of $0.0168 on March 12 and started its reversal on March 14. While Bitcoin is again making strides toward reaching above $70,000, AMP still seems range-bound. However, Amp’s price is expected to start improving during the second half of the year as it moves towards the $0.01 price range, according to the latest Amp price prediction.
AMP Price Predictions 2025 to 2030
| Year | Potential Low ($) | Average Price ($) | Potential High ($) |
| 2025 | 0.0129 | 0.0132 | 0.0144 |
| 2026 | 0.0191 | 0.0198 | 0.0225 |
| 2027 | 0.0285 | 0.0293 | 0.0337 |
| 2028 | 0.0395 | 0.0410 | 0.0488 |
| 2029 | 0.00603 | 0.0619 | 0.0691 |
| 2030 | 0.0877 | 0.0908 | 0.1066 |
AMP Price Forecast for 2025
AMP price prediction for 2025 indicates a bullish trend for Amp, with the maximum price potentially reaching $0.0144. Conversely, the minimum price of the coin might stabilize at $0.0129, with an average trading price of $0.032.
Amp (AMP) Price Prediction 2026
In 2026, based on current projections and technical analysis, Amp’s maximum price is anticipated to reach $0.0225. The minimum price could be around $0.0191, with an average trading price of $0.0198.
Amp Coin Price Prediction 2027
According to our Amp price prediction for 2027, the maximum price is expected to surge to $0.0337. The minimum price could be around $0.0285, with an average trading price of $0.0293.
Amp Price Prediction 2028
Our Amp price prediction for 2028 suggests a maximum price of $0.0488. The minimum price is projected to be $0.0395, with an average trading price of $0.0410.
Amp (AMP) Price Prediction 2029
For the year 2029, the maximum price of Amp is predicted to reach approximately $0.0691. The minimum price is expected to be $0.0603, with an average trading price of $0.0619.
Amp Price Forecast 2030
The AMP price forecast for 2030 suggests a maximum token price of $0.1066. The minimum price is projected at $0.0877, with an average trading price of $0.0908.
AMP Market Price Prediction: Analysts’ Amp Price Forecast
| Firm Name | 2024 | 2025 |
| Wallet Investor | $0.0102 | $0.0592 |
| DigitalCoinPrice | $0.0158 | $0.0184 |
Wallet Investor’s price prediction with respect to Amp (AMP) suggests a bullish scenario. The whole analysis, as carried out by Wallet Investors, investigates a period of positive sentiment for the cryptocurrency. As an upside is expected, the coin value may improve to $0.0102 as well.
Digitalcoinprice has provided an AMP price prediction. It predicts that AMP is most likely to follow an upward trend in the coming years. According to the research, the face value will remain valued at $0.00650 to $0.0158 in 2024. In 2025, the face value may increase to $0.0184.

Cryptopolitan’s Amp Price Prediction
Amp has been down 9.11% over the last 30 days, and there are signs of dropping lower. At current levels, it remains range-bound. Over the next two months, AMP may move into a reversal.
It will achieve a high of $0.0100 in the second half of 2024. In 2025, it will range between $0.0129 and $0.0144, with an average of $0.0132, according to the Amp forecast. Note that the predictions are not investment advice. Seek independent professional consultation or do your own research for investments.
We expect the amp price to reach a high of $0.1066 by the end of 2030.
AMP Historic Price Sentiment
The concept for the AMP ecosystem was conceived in the first quarter of 2019, and the token was officially launched on September 11, 2020, with an initial price of $0.009. In its early months, AMP experienced a downward trend, hitting an all-time low of roughly $0.0007 on November 17 of the same year.
However, the token reversed its fortunes entering 2021. It surpassed its launch price, reaching a notable high of about $0.046 on February 14, 2021. The momentum continued, and by April 18, AMP’s price peaked at $0.064. It set new records, reaching a high of $0.077 on May 7 and then $0.12 on June 16, following its listing on the prominent cryptocurrency exchange, Coinbase.
Despite these spikes, the overall trend for the rest of the year was bearish. By September 2021, AMP had fallen below the $0.05 mark, and by January 2022, it had declined further to $0.02. The bear market proved challenging, and by June of that year, AMP’s price had fallen below its initial launch price. On September 7, it hit a 52-week low of $0.0054.
In 2023, AMP attained a maximum price of $0.00642 and a minimum price of about $0.00146. At the time of writing (May 21, 2024), AMP is trading at $0.00722.
What's Your Reaction?